Questions
Question 1
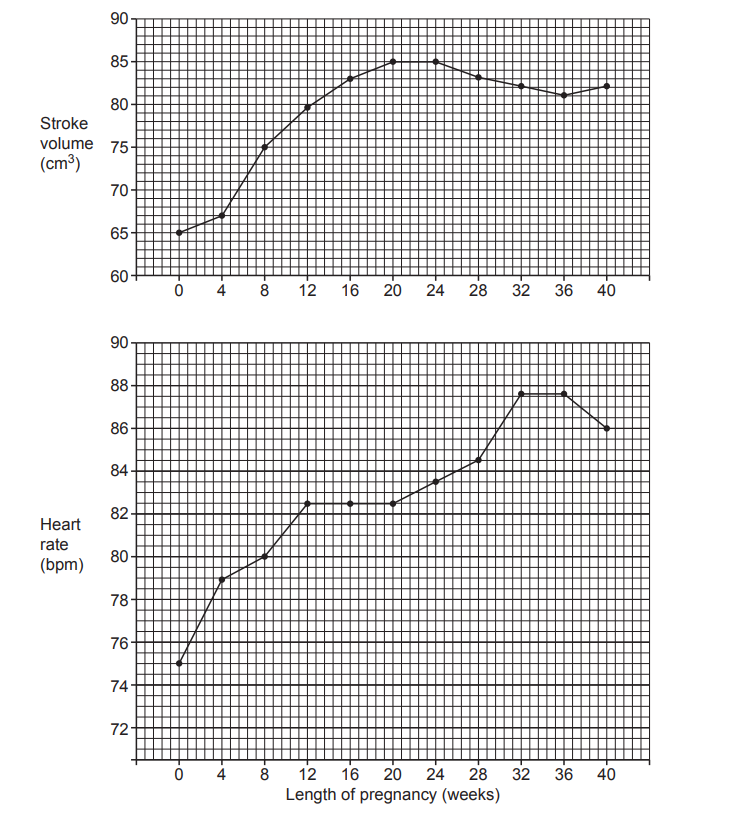
During human pregnancy, cardiovascular adjustments support fetal growth and maternal metabolism. Blood volume increases and endocrine changes alter autonomic control of the heart and blood vessels. Mean stroke volume (upper graph) and heart rate (lower graph) were recorded from early to late pregnancy. Cardiac output is calculated as: cardiac output (CO) = stroke volume (SV) × heart rate (HR).
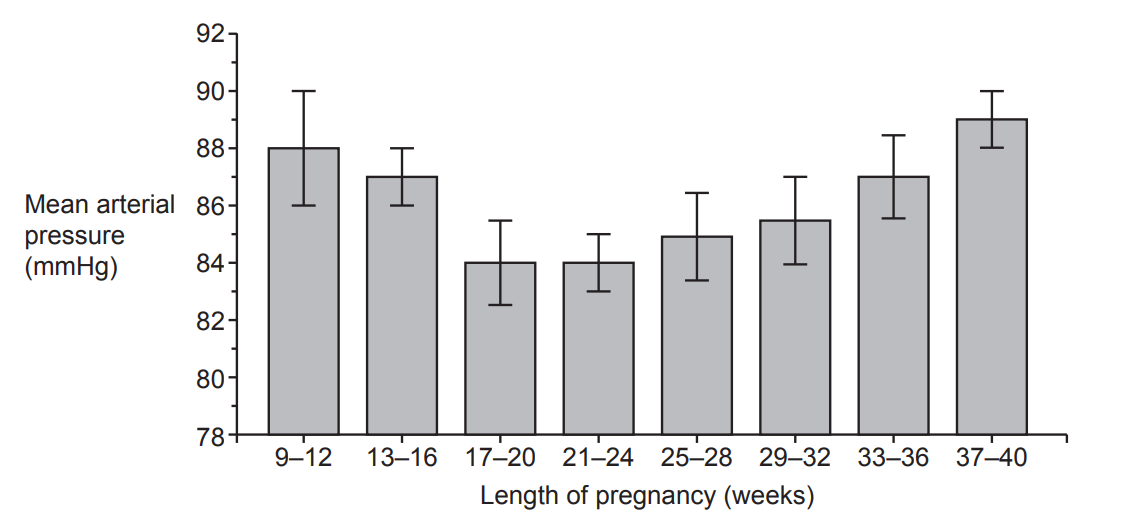
Mean arterial pressure (MAP) reflects the combined effects of cardiac output and systemic vascular resistance. A separate dataset grouped pregnancies into week ranges and measured the mean arterial pressure with error bars indicating variability for each group.
Identify the overall trend in stroke volume from 0–20 weeks.
Calculate the approximate percentage increase in heart rate from 0 to 32 weeks. Show your working.
Using the graphs, predict whether cardiac output increases, decreases or remains constant from 8 to 28 weeks. Justify your answer with reference to both SV and HR.
Identify one time interval where stroke volume decreases while heart rate increases.
Suggest one physiological reason for the rise in heart rate during late pregnancy.
Compare the mean MAP at 17–20 weeks with 33–36 weeks.
Describe how variability, as shown by the error bars, changes across the gestational groups.
Comment on whether MAP at 37–40 weeks is likely to be different from 21–24 weeks, based on the error bars.
Suggest one homeostatic mechanism that could account for a mid‑pregnancy decrease in MAP despite an increase in cardiac output.
Question 2
A cladogram shows evolutionary relationships among three New Zealand parrots and indicates the timing of a major mountain uplift that separated populations.
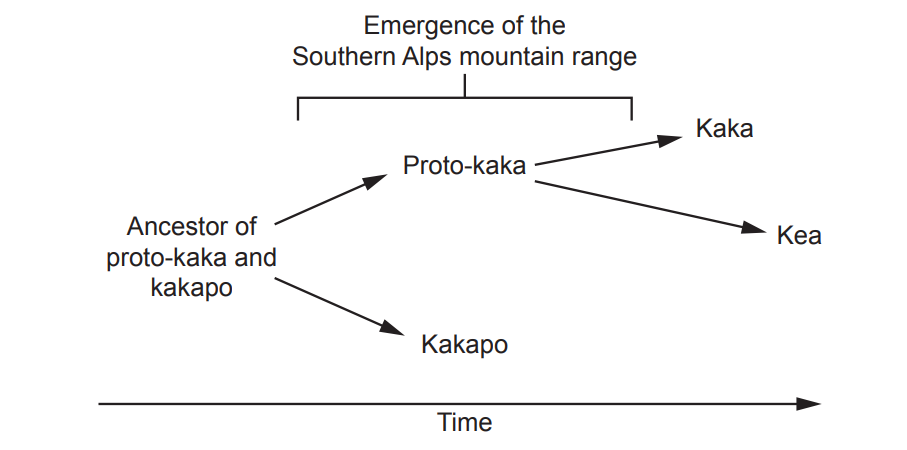
Identify the sister taxa shown.
State the most likely mode of speciation linked to the mountain uplift.
Explain how the geological change could lead to reproductive isolation over time.
Suggest one molecular dataset that could test the relationships shown.