Questions
Question 1
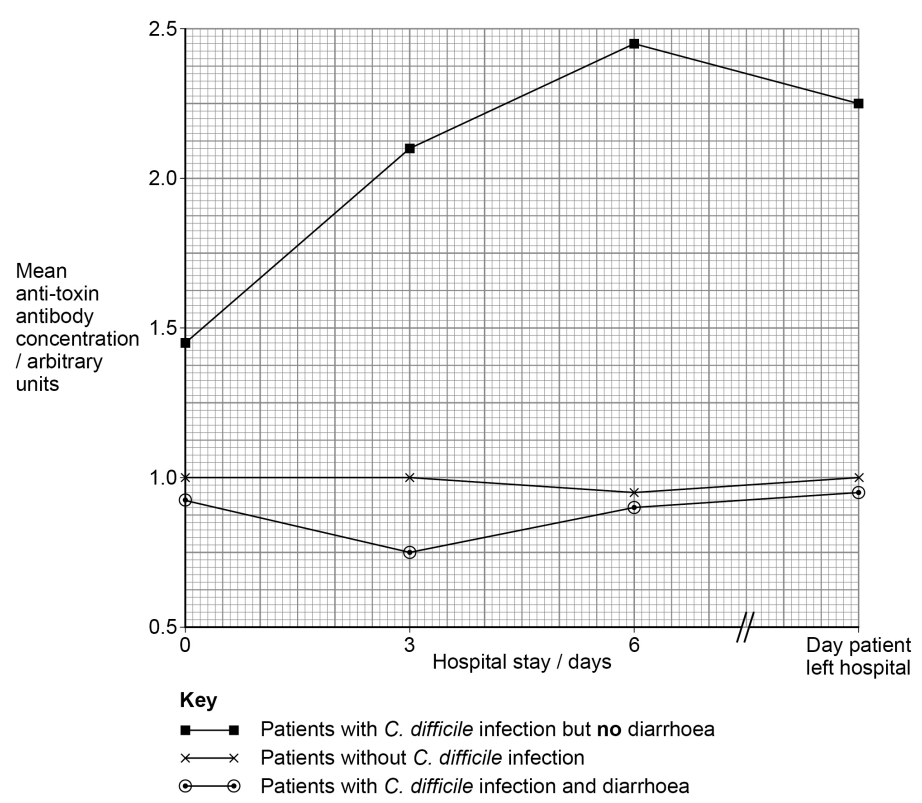
Hospitals routinely store anonymised sera for method calibration and quality control. Antibody titres may be tracked across a patient’s stay to understand immune dynamics under standard care (for example, fluids, antibiotics, physiotherapy). Such records can be influenced by ward routines (meal times, blood‑draw windows) and logistics (sample transport, freezer cycles) even when the clinical question is not immunology‑focused. In this study, mean anti‑toxin antibody concentration in plasma was sampled on admission (day 0), day 3, day 6 and on the day the patient left the hospital. Three categories are shown: patients with Clostridioides difficile infection and diarrhoea; patients with C. difficile infection but no diarrhoea; and patients without C. difficile infection.
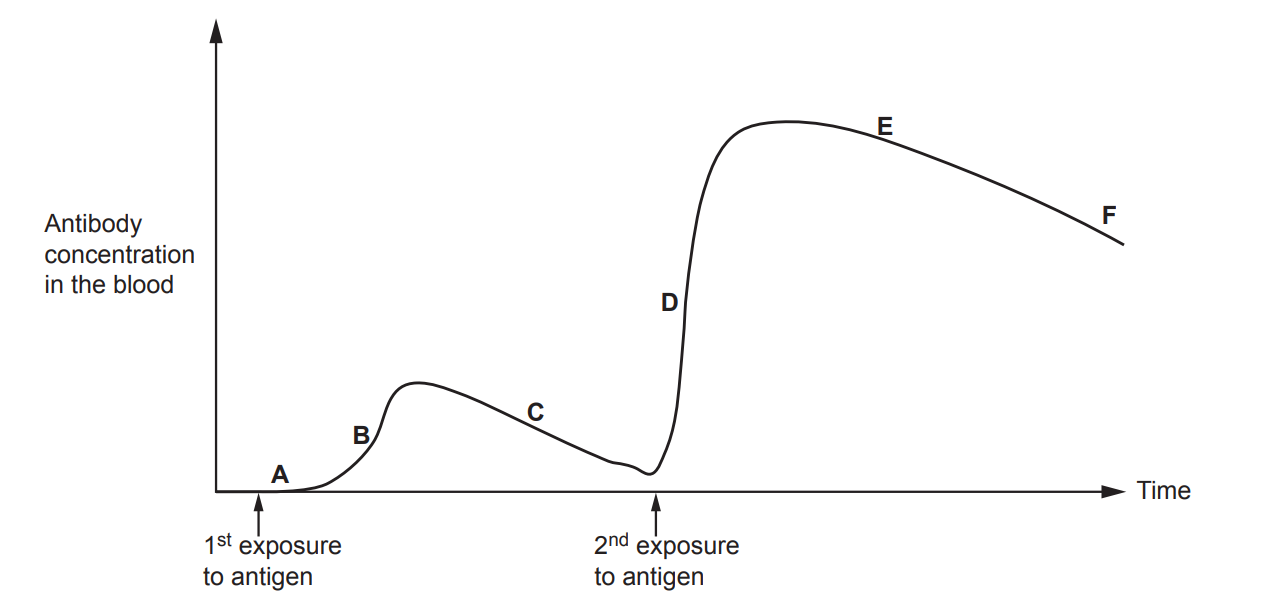
The second diagram for this question shows a stylised antibody response curve following first exposure to an antigen (A→C) and a later second exposure (D→F). The axes are qualitative but capture typical immunological behaviour.
Using the graph:
Identify which patient category shows the greatest rise in antibody concentration by day 6.
Estimate the antibody concentration for patients without infection on day 6. State appropriate units.
Calculate the change in antibody concentration from day 0 to day 6 for patients with infection but no diarrhoea. Show working.
Describe the overall trend for patients with infection and diarrhoea from day 0 to exit.
Propose a sampling schedule that minimises circadian effects on antibody measurements and justify your choice.
Explain why including the “no infection” group improves interpretation of the data.
Using the graph:
Name the type of immune response shown after the second exposure (region D→E).
Compare the speed and magnitude of the secondary response (D→E) with the primary response (A→B→C).
Explain the immunological basis for the difference between the primary and secondary responses.
Predict what would happen to the antibody curve if the second exposure were to a different antigen.
Question 2
The micrograph shows a mitochondrion in longitudinal section. Dense inner folds and a granular interior are visible, typical of active eukaryotic cells.
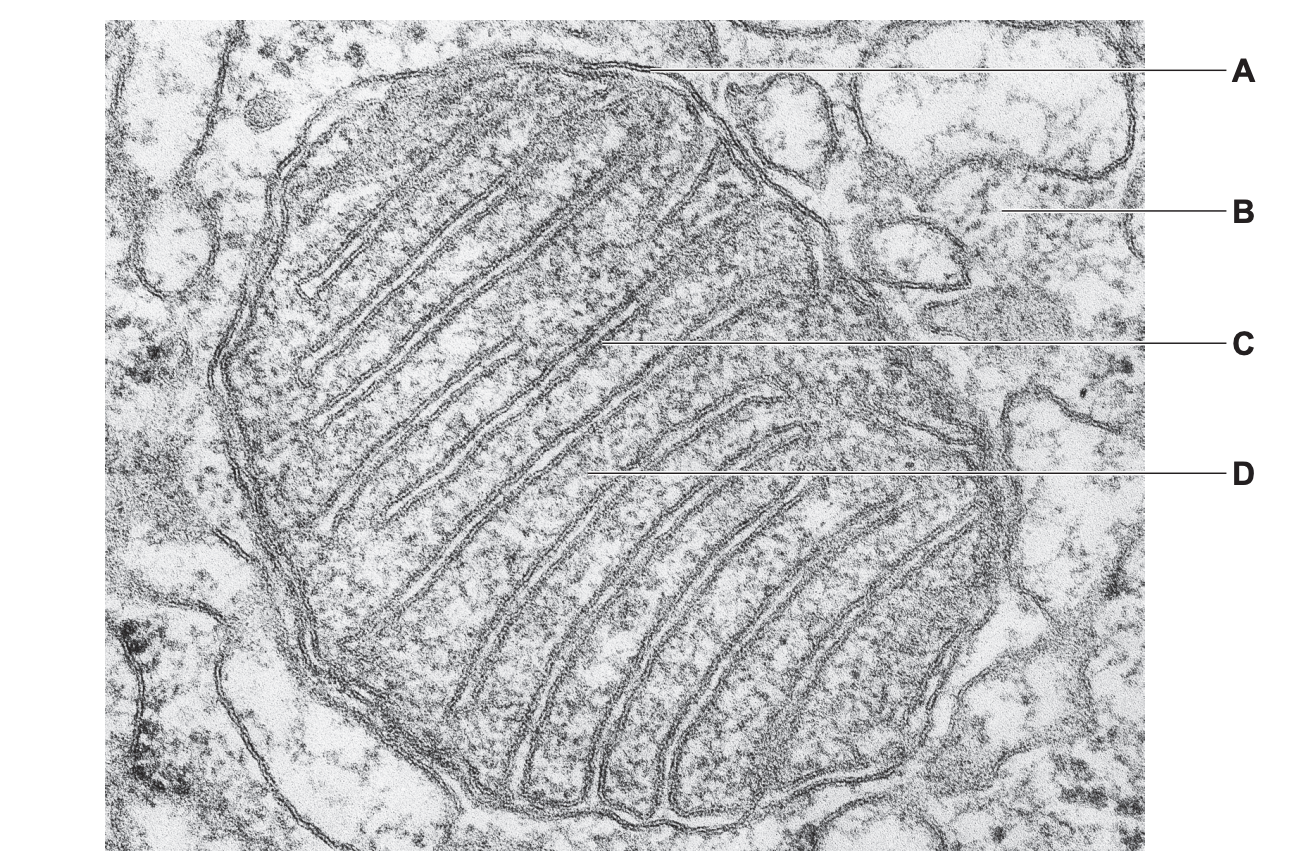
Identify the structures labelled C and D.
Describe how the structure identified as C increases the rate of aerobic respiration.
Explain how the double membrane creates distinct environments for stages of aerobic respiration.