Questions
Question 1
A showroom sells cars in five price ranges over one year. A frequency density histogram (with unequal class widths) summarises the data. It is given that 66 cars in the price range £10 000–£20 000 were sold.
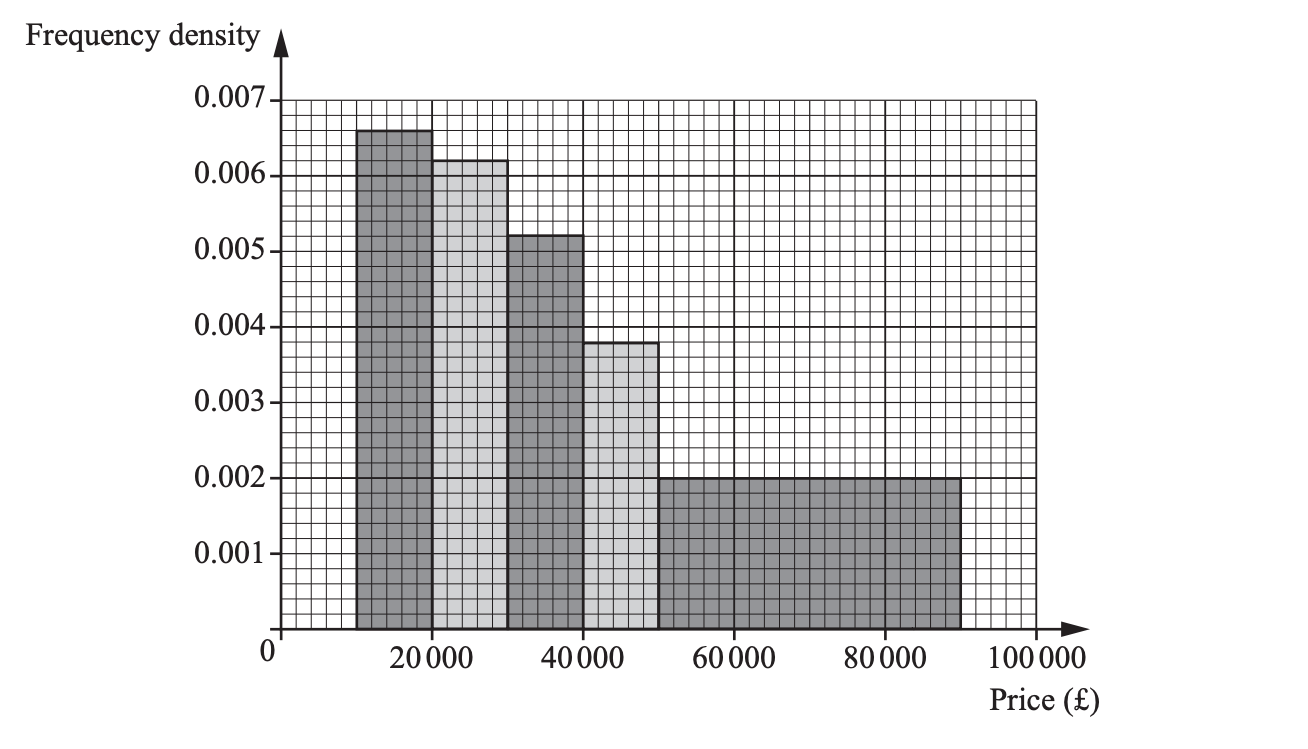
Explain why the bar for £10 000–£20 000 must have frequency density (cars per £). Hence, state the scale of the vertical axis to d.p.
Let the frequency densities of the remaining classes, in order of increasing price, be , , , (cars per £).
Write an expression for the total number of cars sold in the year in terms of , , , . State the class widths you used.
By reading the histogram carefully (use the tick marks and grid), estimate the heights , , , to the nearest . Hence estimate the number of cars sold in each class and the total .
Use your class frequencies to estimate the median price of a car sold. Use linear interpolation within the relevant class and show your working.
For price (in £) with , assume the frequency density (cars per £) decays exponentially: , with .
Using the point at the centre of the first full-width bar and the point at the centre of the final (long) bar (read these from the histogram), determine and , giving each to s.f. Comment on the appropriateness of this model for the middle price classes.
A manager states: “At least of cars sold cost more than £40 000.”
Use your histogram-based calculations to assess this claim, giving a justified conclusion.