Questions
Question 1
A car dealership recorded sale prices of cars over one year. The histogram shows frequency density against price. It is known that 66 cars were sold in the price range to .
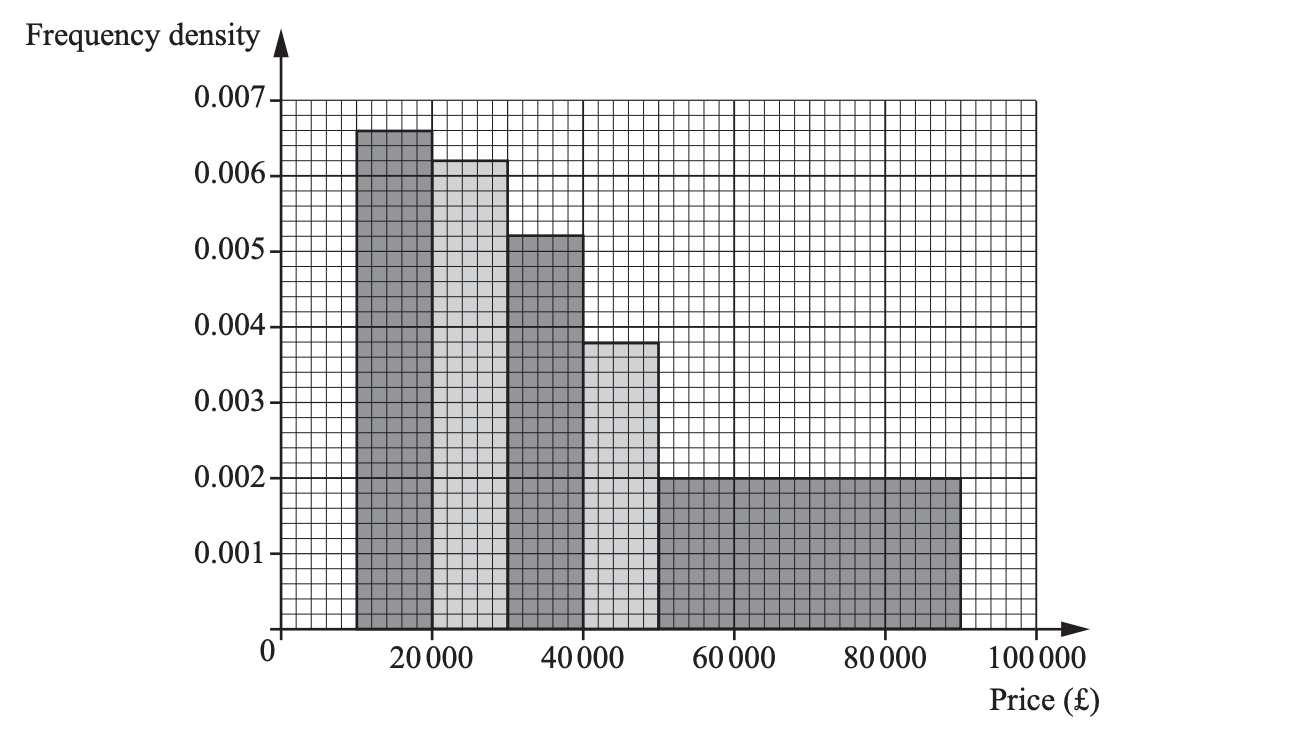
The frequency density for a class is defined as
Show that the frequency density for the – class is .
By reading the histogram, write down the frequency density for the – class.
Hence estimate the number of cars sold in the – class.
Using the axes and scale from the histogram, estimate the frequency in each class and the total number of cars sold. Show your working; you may present your results in a short table.
Using class midpoints together with your class frequencies from part (d), use your GDC to estimate the mean sale price (to the nearest ).
Comment on the skewness of the distribution, giving a reason from the histogram.