Questions
Question 1
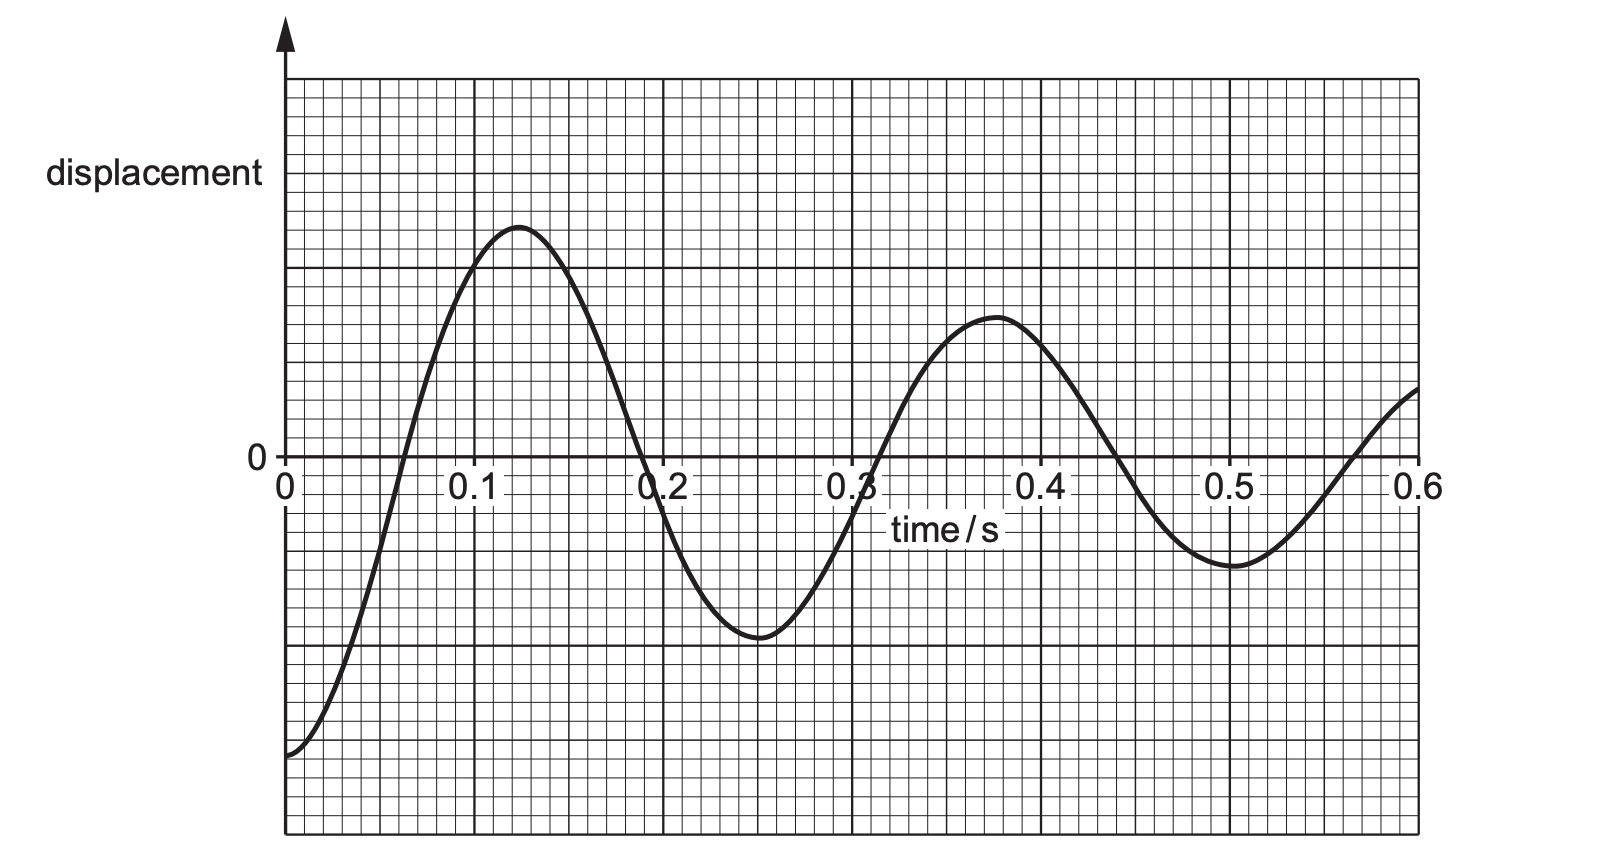
A ball performs vertical oscillations with displacement about the equilibrium position . The displacement–time graph from to shows damped oscillations.
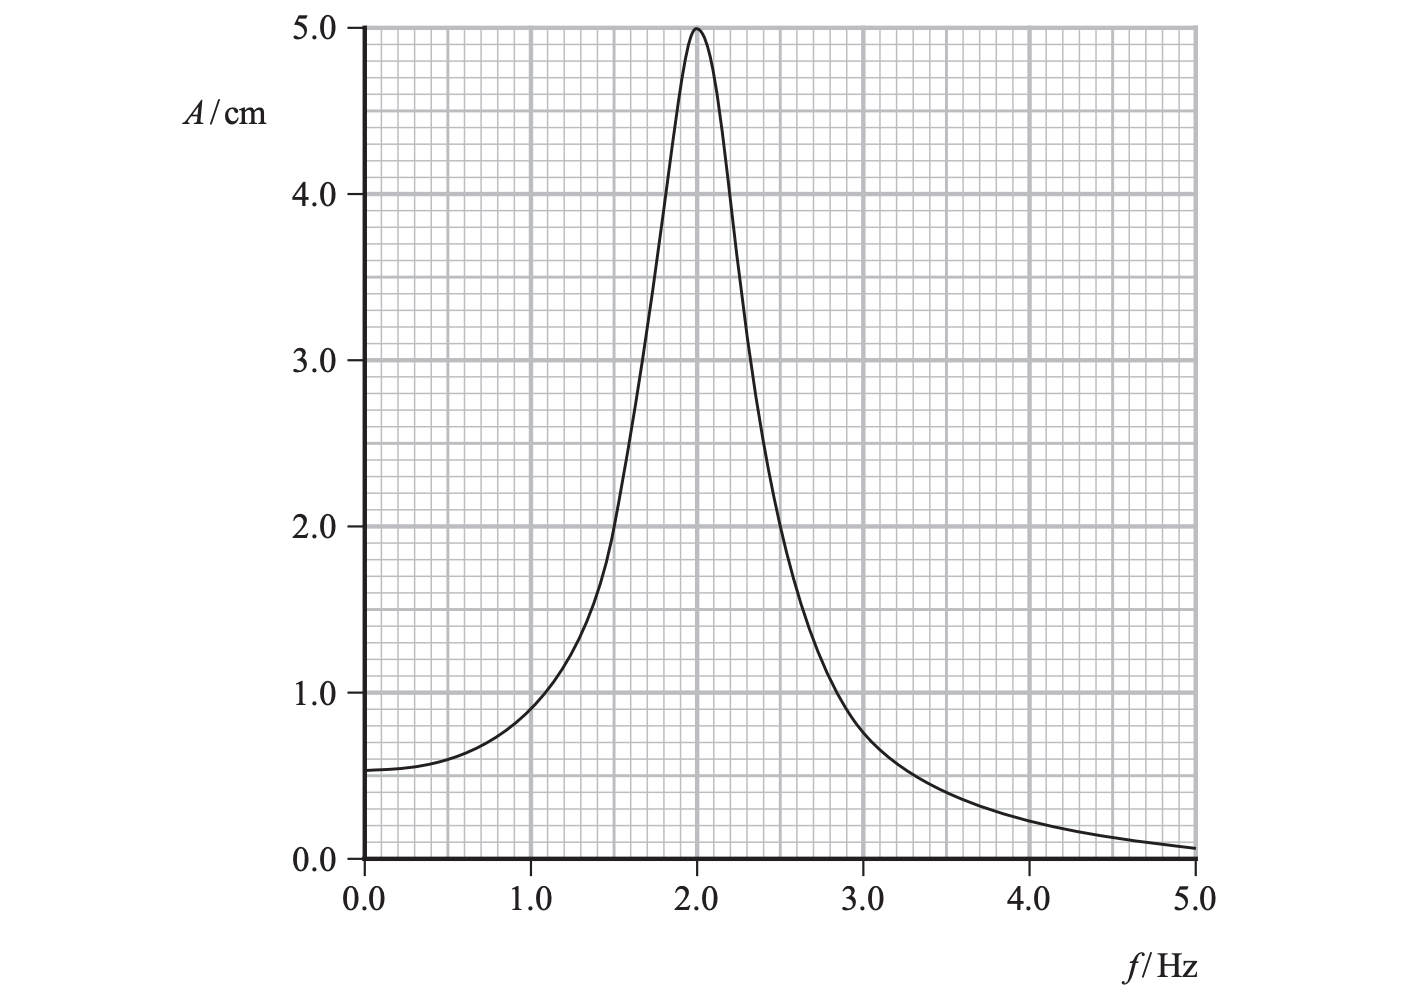
The steady-state amplitude of a driven oscillator is measured as the driving frequency is varied. The amplitude–frequency graph has a clear peak near .
Part a
[2]
State what is meant by the period and the amplitude of an oscillation.
Part b
[2]
Determine the period of the motion using the graph. Show how the value is obtained from the graph.
Part c
[2]
Using the graph, estimate the resonant (natural) frequency and the full width at half maximum . Hence calculate the quality factor .
Part d
[1]
The amplitude on the displacement–time graph decreases with time. Explain this decrease in terms of forces and energy.
[7]