Sources and impacts of water pollution
· Water pollution = contamination of freshwater or marine systems, reducing water quality, ecosystem function and human use.
· Key sources: sewage, agricultural run-off, industrial effluent, urban run-off, solid waste disposal and oil spills.
· Sewage adds organic matter, pathogens and nutrients; it raises BOD and can reduce dissolved oxygen.
· Agricultural run-off adds nitrates and phosphates, causing eutrophication and algal blooms.
· Industrial effluent may add heavy metals, toxic chemicals, persistent pollutants and heat.
· Urban run-off carries oil, metals, litter, microplastics and suspended solids from roads and impermeable surfaces.
· Oil spills reduce light penetration, coat organisms, poison wildlife and damage fisheries, tourism and coastal habitats.
· Exam example: Deepwater Horizon oil spill, Gulf of Mexico, 2010 — source: offshore drilling blowout; impacts: oil contamination, wildlife mortality, fishery closures, habitat damage; management: capping the well, skimming, controlled burning, dispersants, clean-up and legal compensation.
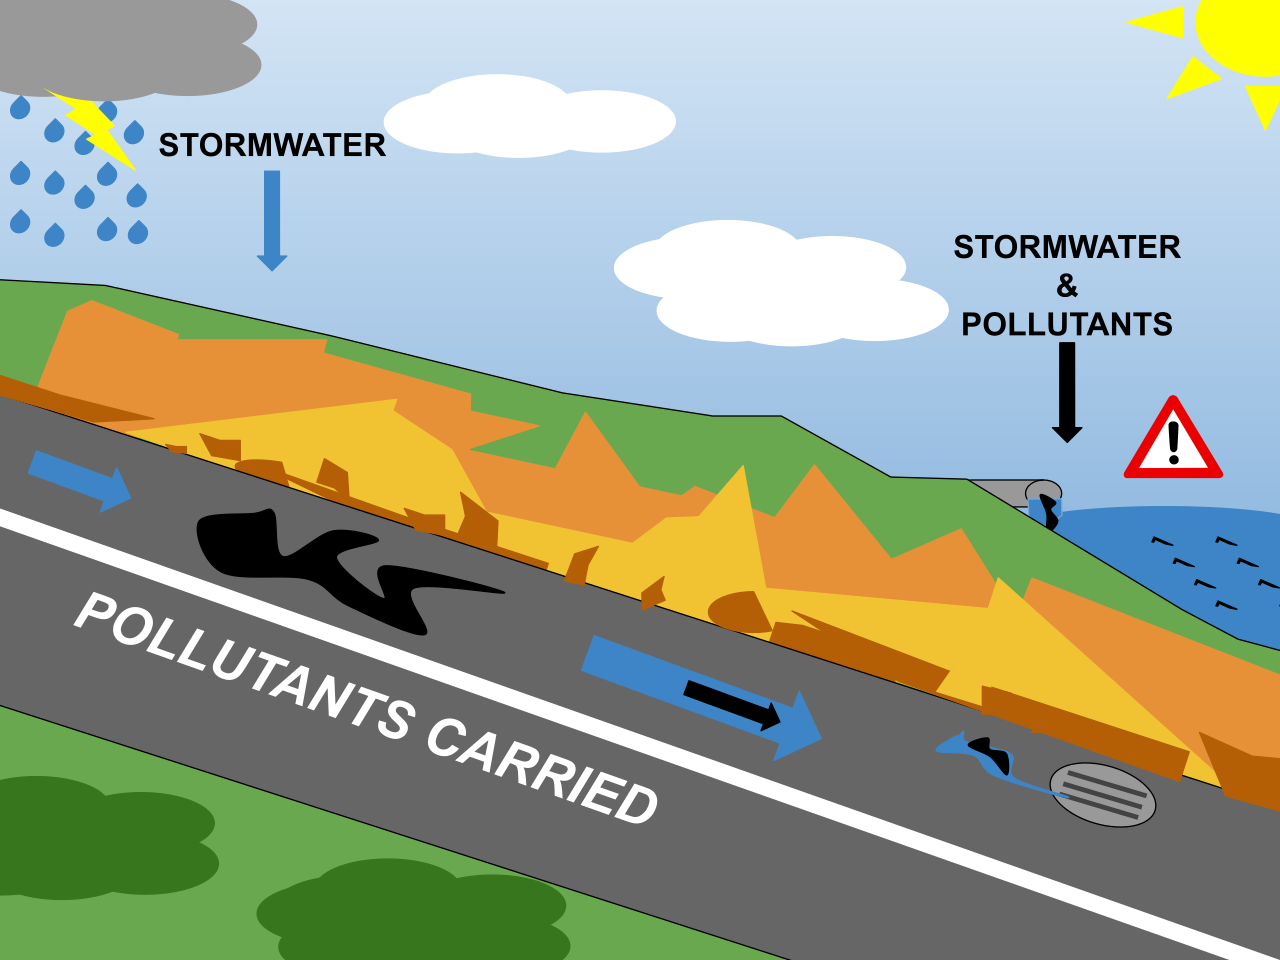
This diagram shows how urban surfaces increase polluted run-off into aquatic systems. It is useful for linking urban run-off, impermeable surfaces and water pollution sources in exam answers. Source
Plastic debris and microplastics
· Plastic debris accumulates in marine environments because many plastics are persistent, buoyant and transported by rivers and ocean currents.
· Large plastics harm wildlife through entanglement, ingestion, suffocation, reduced feeding and injury.
· Ocean currents concentrate plastics in oceanic gyres, forming major accumulation zones such as the Great Pacific Garbage Patch.
· Microplastics = small plastic particles that enter food webs directly or form by fragmentation of larger plastics.
· Microplastics can absorb surface toxins such as persistent organic pollutants, then transfer them through food chains.
· Exam link: microplastics and associated toxins can bioaccumulate in organisms and biomagnify along food chains.
· Management: reduce plastics in the supply chain, improve waste management, ban or reduce single-use plastics, redesign packaging, clean up existing pollution and change consumer behaviour.
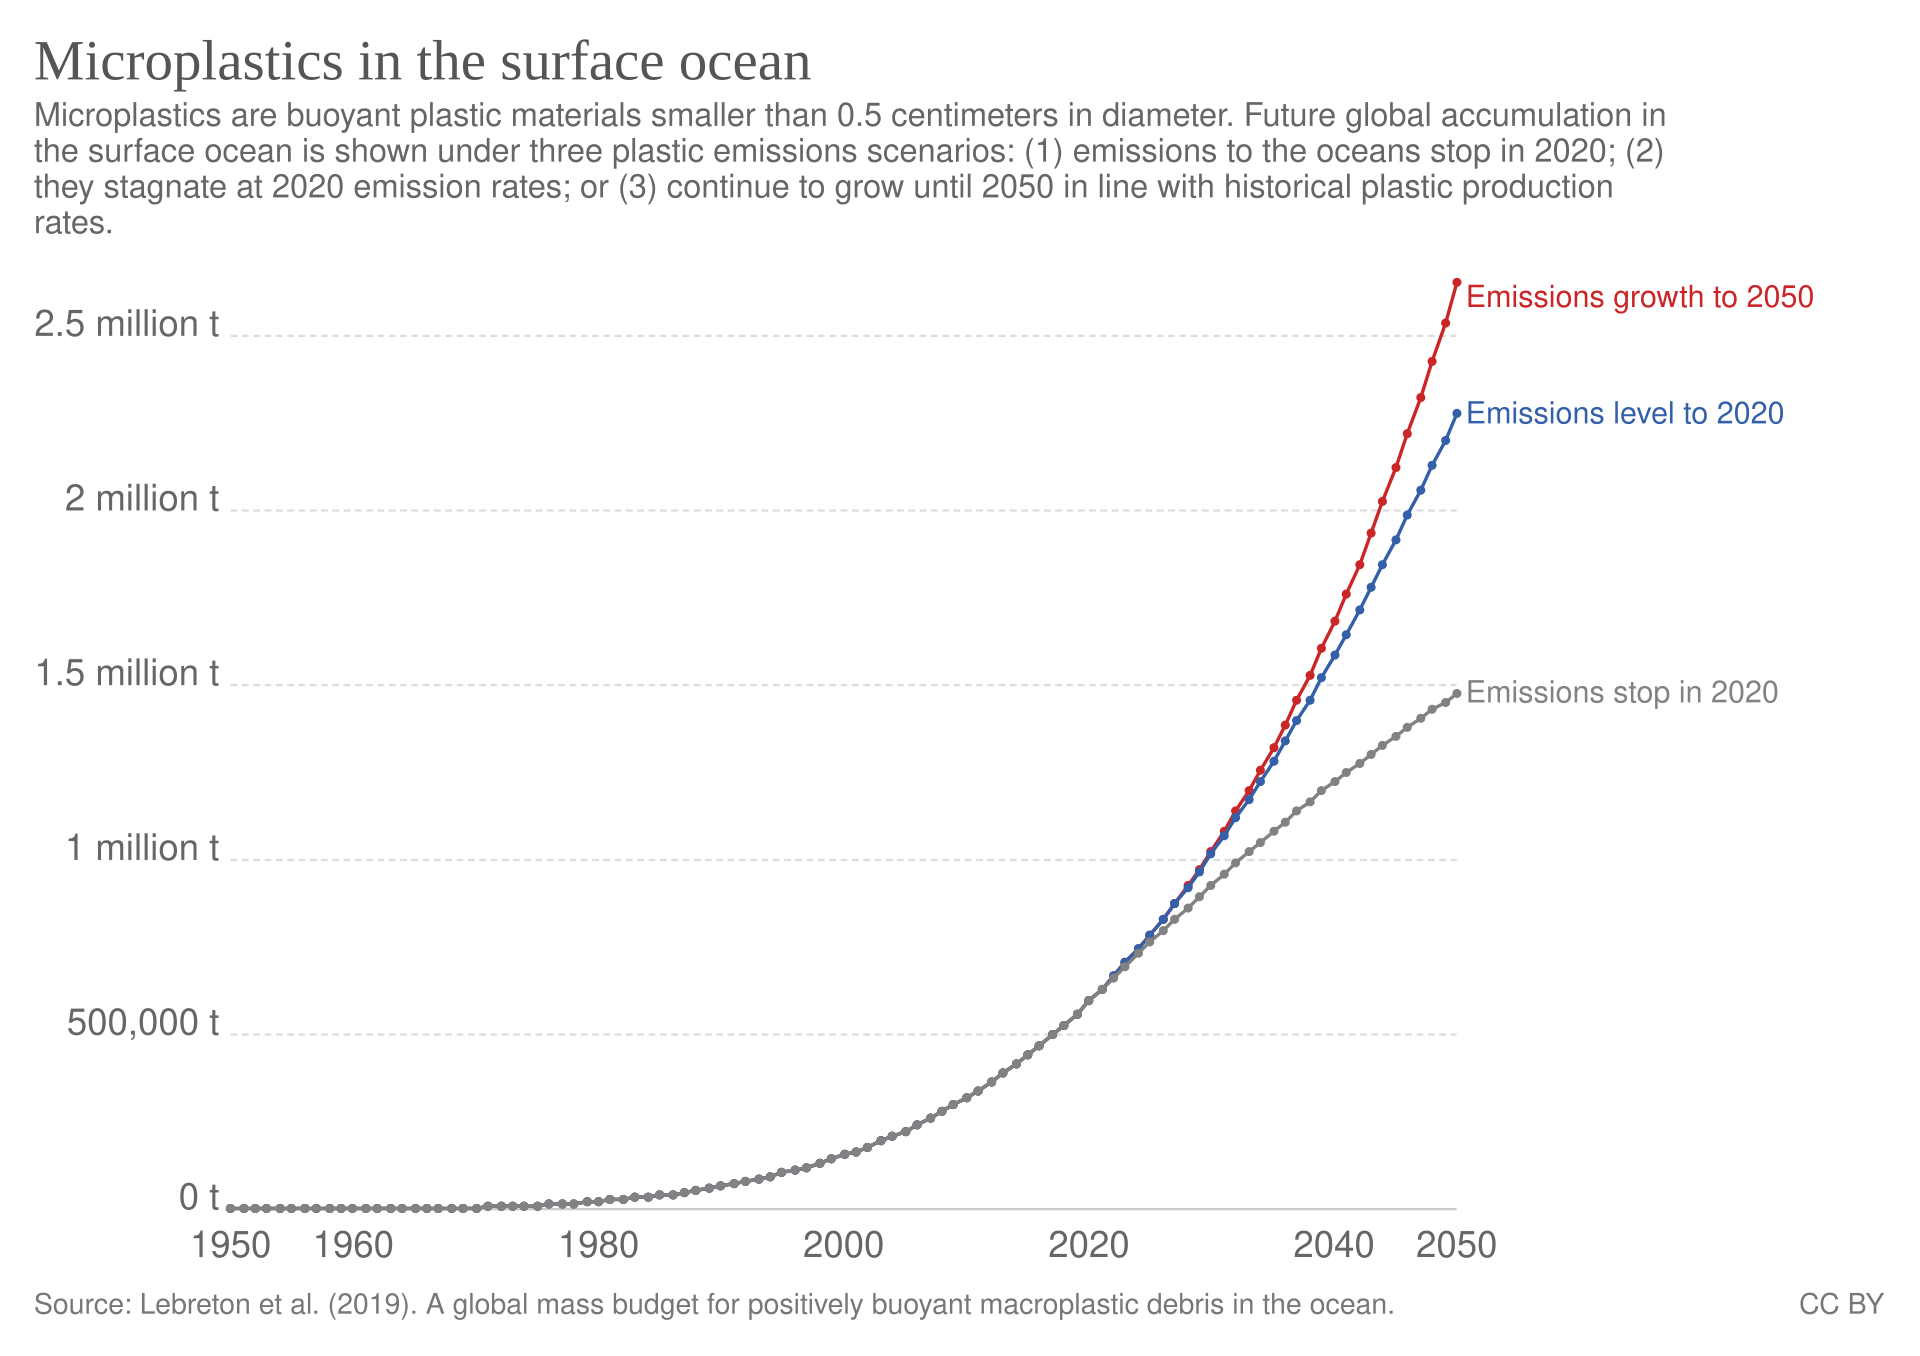
This graph helps students interpret how future microplastic loads depend on plastic emissions. It supports evaluation of why prevention at source is more effective than only cleaning up existing plastic. Source
Measuring water quality
· Water quality = measurement of chemical, physical and biological characteristics of water.
· Common indicators: dissolved oxygen (DO), pH, temperature, turbidity, nitrates, phosphates, specific metals and total suspended solids (TSS).
· Dissolved oxygen: low DO indicates stress for aerobic aquatic organisms; very low DO leads to hypoxia or anoxia.
· pH: extreme pH can harm organisms and affect metal toxicity.
· Temperature: warmer water holds less oxygen and can increase biological activity.
· Turbidity: high turbidity reduces light penetration, photosynthesis and feeding efficiency of visual predators.
· Nitrates/phosphates: high values indicate nutrient enrichment and risk of eutrophication.
· Water quality index (WQI) = a single weighted score combining several test parameters to represent overall contamination.
· Field methods: oxygen probe, pH probe, thermometer, Secchi disc, nitrate/phosphate test kits and tests for TSS.
Biochemical oxygen demand (BOD)
· Biochemical oxygen demand (BOD) = amount of dissolved oxygen required by microorganisms to decompose organic material in water.
· Standard measure: mg oxygen consumed per litre of sample over 5 days at 20°C.
· High BOD indicates high organic pollution, often from sewage, manure, food-processing waste or other biodegradable waste.
· High BOD causes microorganisms to use oxygen rapidly, lowering DO and increasing risk of hypoxia, anoxia and fish death.
· Exam interpretation: high BOD = high organic matter = low DO risk = poorer water quality.
Eutrophication sequence
· Eutrophication = enrichment of water by mineral nutrients, especially nitrates and phosphates.
· Main human causes: fertilizer run-off, sewage, detergents and nutrient-rich waste entering lakes, estuaries or coastal waters.
· Sequence: nutrient input → rapid phytoplankton/algal bloom → reduced light penetration → submerged plants die → algae die → decomposition increases → BOD increases → DO decreases → hypoxia/anoxia → death of fish and aerobic organisms.
· Algal blooms only occur where phytoplankton growth was previously limited by low nitrate and/or phosphate availability.
· Positive feedback example: more nutrients → more algal growth/death → more decomposition → more nutrients released from dead organisms/sediments → further algal growth.
· Eutrophication can push aquatic systems toward a tipping point and an alternative low-oxygen state.
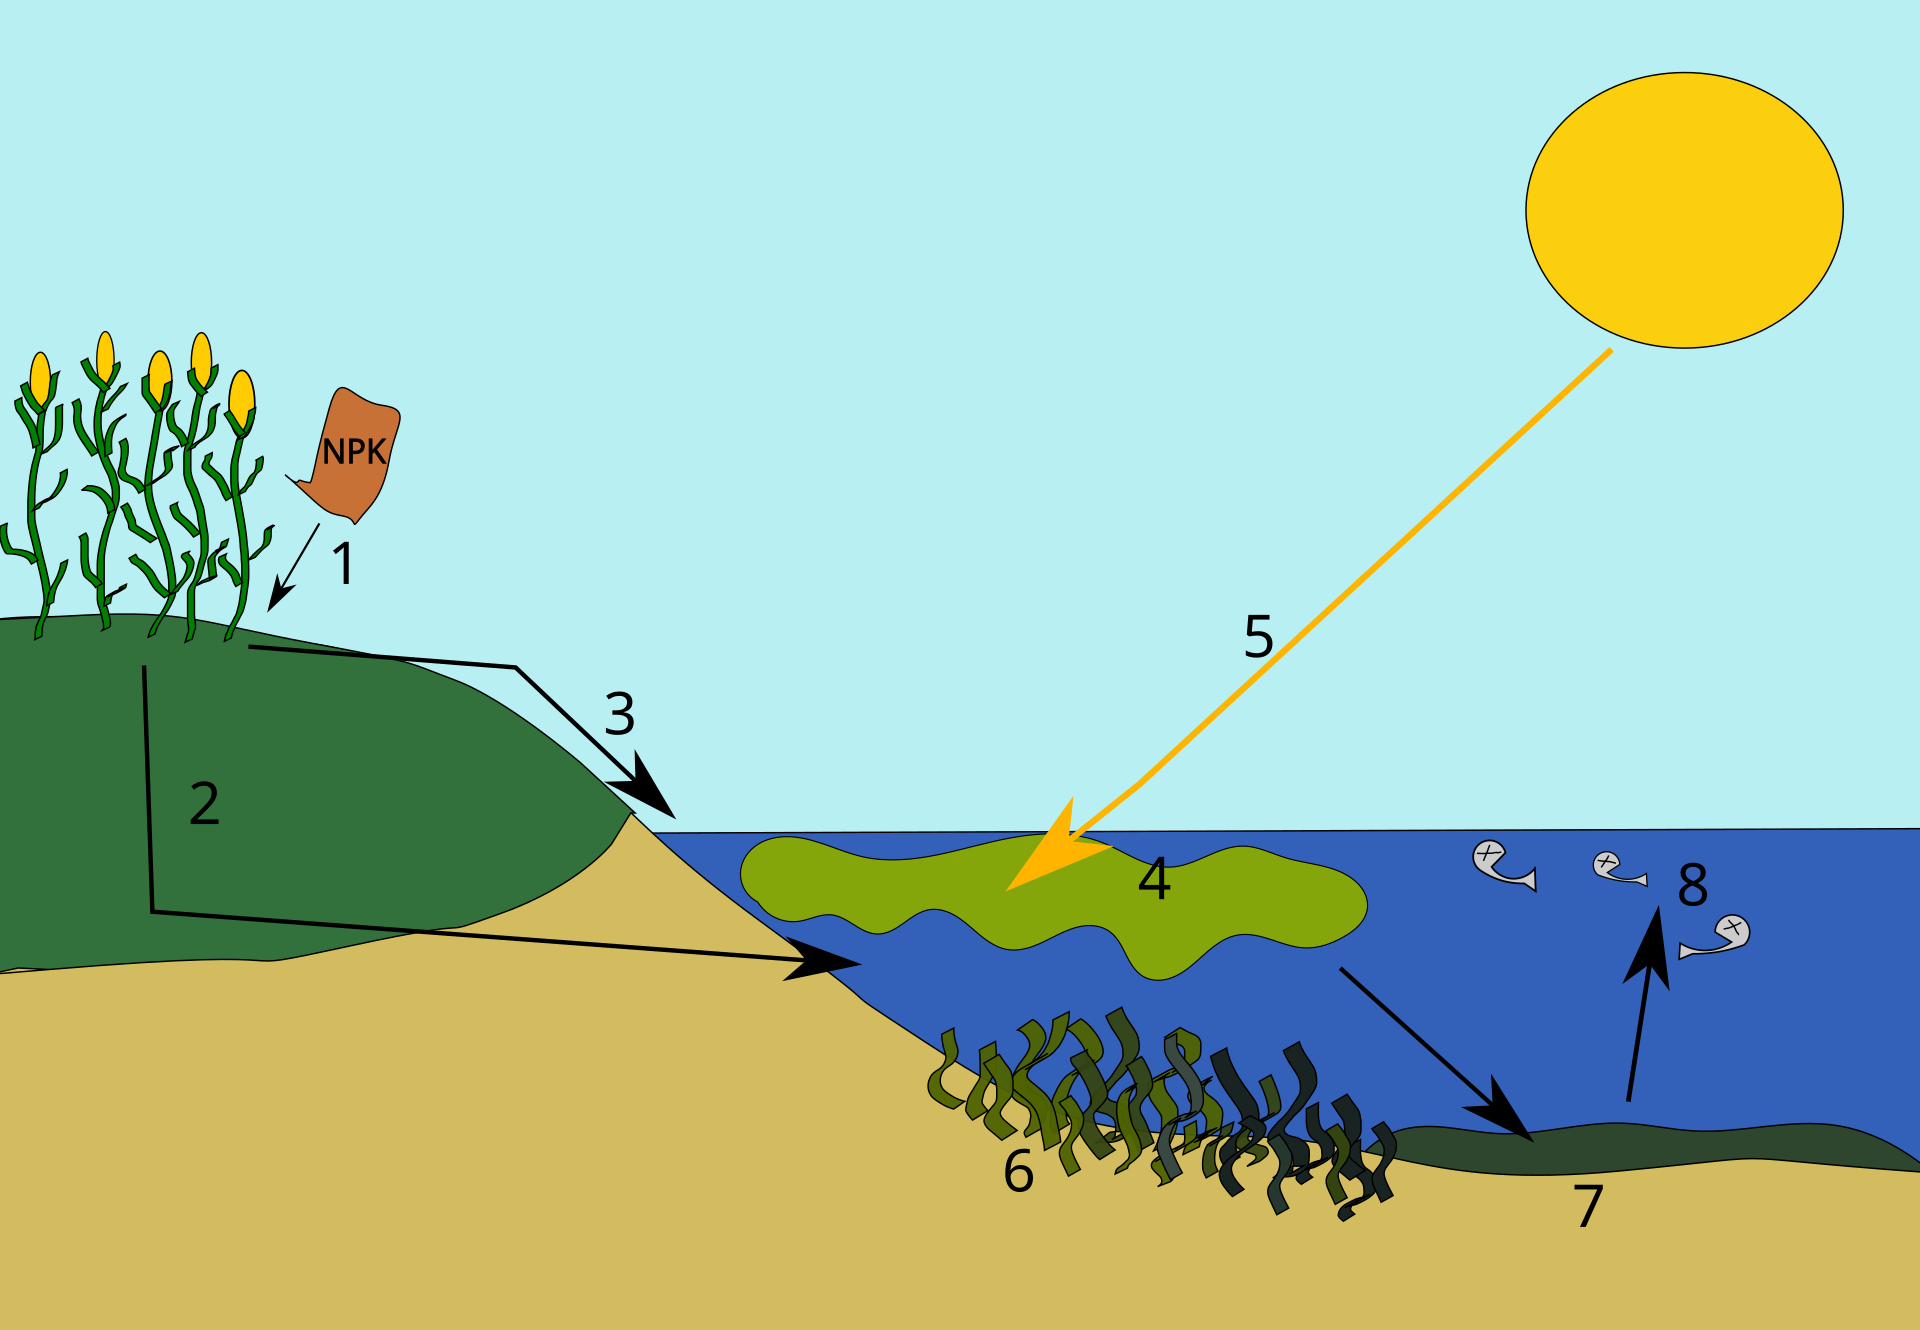
This diagram shows the core eutrophication sequence from nutrient run-off to oxygen depletion. It is ideal for revising cause-and-effect chains and positive feedback in aquatic systems. Source
Ecosystem services affected by eutrophication
· Fisheries: fish kills and loss of commercially valuable species reduce food supply and income.
· Recreation: algal scums, odours and unsafe water reduce swimming, boating and tourism.
· Aesthetics: cloudy water, surface blooms and dead organisms reduce perceived environmental value.
· Health: toxic blooms and pathogen-rich water can threaten humans, livestock and wildlife.
· Strong exam answers link eutrophication to ecological, economic and social impacts.
Managing eutrophication and other water pollution
· Level 1 — reduce pollutant-producing activities: use alternative fertilizers, precision fertilizer application, buffer strips, organic farming methods and phosphate-free detergents.
· Level 2 — reduce pollutant release: improve wastewater treatment, remove nitrates/phosphates before discharge, control industrial effluent and manage urban stormwater.
· Level 3 — remove pollutants and restore ecosystems: dredge nutrient-rich mud, aerate water, remove algal biomass, reintroduce plants/fish and restore wetlands.
· Best evaluation answers compare prevention at source versus end-of-pipe treatment versus ecosystem restoration.
· Prevention is usually cheaper and more sustainable, but restoration may be needed where pollution is already severe.
HL only: wider range of water pollutants
· Water pollutants include organic matter such as sewage, dissolved substances, persistent chemicals, plastics and heat energy.
· Tributyltin (TBT) = toxic anti-fouling chemical and endocrine-disrupting chemical used historically on boats.
· PCBs = persistent chemicals that can bioaccumulate and biomagnify in food chains.
· Thermal pollution = discharge of heated water; it reduces oxygen solubility and can stress aquatic organisms.
· Persistent pollutants are high-risk because they remain in the environment, accumulate in organisms and may affect top predators most.
HL only: harmful algal blooms and dead zones
· Harmful algal blooms (HABs) can include cyanobacteria, algae, protists and dinoflagellates.
· Some HAB organisms produce toxins that threaten humans and animals.
· In freshwater, cyanotoxins are common; in marine systems, some dinoflagellates produce toxins and may cause red tides.
· Hypoxic waters have low dissolved oxygen; anoxic waters have no dissolved oxygen.
· Frequency of hypoxic/anoxic waters is likely to increase due to combined effects of global warming, freshwater stratification, sewage disposal and eutrophication.
· Dead zones form when oxygen is too low to support most aerobic aquatic life.
HL only: sewage treatment
· Primary treatment removes large solids and settleable material by screening and sedimentation.
· Secondary treatment uses microorganisms to biologically decompose dissolved and suspended organic matter, reducing BOD.
· Tertiary treatment removes remaining nutrients, pathogens or specific pollutants, often including nitrate/phosphate removal and disinfection.
· Sewage treatment allows safer release of effluent, but high cost and infrastructure needs create equity challenges between societies.
· Strong evaluation point: untreated sewage is a health and ecosystem risk, but advanced treatment requires funding, governance, energy and maintenance.
HL only: indicator species and biotic indices
· Indicator species show water quality because some species are pollution-tolerant while others are pollution-sensitive.
· Tolerant examples: bloodworms, rat-tailed maggots and some sludge worms indicate polluted or low-oxygen water.
· Intolerant examples: mayfly nymphs, stonefly nymphs and caddisfly larvae indicate cleaner, well-oxygenated water.
· Biotic index = indirect water-quality measure based on pollution tolerance, relative abundance and species diversity.
· Trent biotic index is an example; it uses macroinvertebrate communities to infer water quality.
· Practical skill: apply a named biotic index and interpret results alongside abiotic data such as DO, pH and turbidity.
HL only: WQI, standards and citizen action
· Water quality index (WQI) combines multiple parameters into one weighted score to compare sites or monitor change over time.
· WHO drinking water quality guidelines and local statutory standards help regulate safe water and pollution control.
· Regulations and standards matter in environmental impact assessments and international business agreements.
· Citizen action can reduce pollution through consumption choices, correct waste disposal, peaceful protest, data collection, research, legal action and lobbying lawmakers.
· Evaluation link: water pollution management is influenced by different perspectives, including governments, businesses, local communities, NGOs and consumers.
Checklist: can you do this?
· Explain the sequence from nutrient input to eutrophication, high BOD, low DO and fish death.
· Interpret water-quality data for DO, pH, temperature, turbidity, nitrates, phosphates and TSS.
· Compare three levels of pollution management: reduce activity, reduce release, remove/restore.
· Describe one detailed water pollution case study with location, source, impacts and management.
· HL: apply BOD, biotic index, indicator species, WQI and sewage treatment stages in exam or practical contexts.