
OCR Specification focus:
‘Relate classification to phylogeny; understand evolutionary relationships without needing cladistics details at this level.’
Biological classification organises living organisms based on shared characteristics, while phylogeny explores their evolutionary relationships. Together, they form the framework for understanding biodiversity and evolution.
The Purpose of Classification
Classification provides a universal system to identify, name, and group organisms. It helps biologists communicate accurately, infer evolutionary links, and study ecological interactions efficiently.
The Hierarchical Nature of Classification
Organisms are placed within a hierarchical system of taxonomic ranks:
Domain
Kingdom
Phylum
Class
Order
Family
Genus
Species
Each rank groups organisms sharing common features, with species being the most specific level — describing organisms capable of interbreeding to produce fertile offspring.
Taxonomy: The science of naming, describing, and classifying organisms into an ordered system based on shared characteristics.
Taxonomy aims to reflect evolutionary history, so that groups within the hierarchy represent branches of the tree of life.
Phylogeny: The Evolutionary Framework
Phylogeny refers to the evolutionary history and relationships among species or groups of organisms. These relationships are often represented using phylogenetic trees.
Phylogeny: The study of the evolutionary history and relationships among organisms.
A phylogenetic tree is a diagram showing lines of evolutionary descent from a common ancestor.
Each branch point (node) represents a divergence event, where ancestral species split into two or more distinct lineages. The length of branches can sometimes indicate evolutionary time or the amount of change.
Key Concepts in Phylogenetics
Common ancestor: The species from which two or more lineages evolved.
Monophyletic group (clade): A group consisting of a common ancestor and all its descendants.
Paraphyletic group: Includes a common ancestor but not all its descendants.
Polyphyletic group: Includes species from different ancestors, usually grouped by similar traits, not evolutionary history.
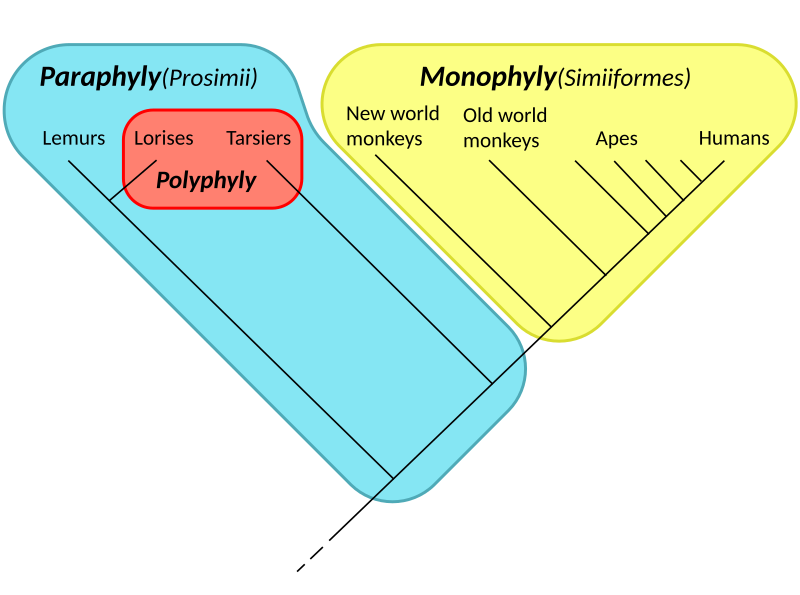
A side-by-side diagram illustrating monophyletic (clade), paraphyletic, and polyphyletic groupings on phylogenetic trees. It clarifies that only monophyletic groups include a common ancestor and all descendants, aligning modern classification with phylogeny. No extra content beyond the syllabus is included. Source.
Linking Classification with Phylogeny
Modern classification seeks to reflect phylogenetic relationships, meaning organisms grouped together should share a recent common ancestor.
Early classification systems (such as Linnaeus’s) relied primarily on morphological features, but these can be misleading due to convergent evolution — where unrelated organisms independently evolve similar traits.
Convergent evolution: The independent evolution of similar traits in species of different lineages, often due to similar environmental pressures.
From Morphology to Molecular Evidence
As technology advanced, classification has shifted towards molecular phylogenetics, using:
DNA and RNA sequences
Protein structures and amino acid sequences
Genomic data
These molecular comparisons provide more precise insights into evolutionary relationships. Organisms that appear dissimilar can share close genetic relationships, revealing unexpected connections within the tree of life.
Interpreting Phylogenetic Trees
Phylogenetic trees are fundamental tools for visualising evolutionary relationships. Understanding how to read them is essential for appreciating the link between classification and evolution.
Key Features:
Root: Represents the most recent common ancestor of all organisms in the tree.
Branches: Show the divergence of species or groups over time.
Nodes: Represent speciation events — points where a lineage splits.
Clades: Groups that include a common ancestor and all its descendants.
Each clade corresponds to a taxonomic group in classification. For example:
All mammals form a clade within vertebrates.
Within mammals, primates form another clade, and humans are one species within that clade.
Evidence Supporting Phylogenetic Classification
Multiple sources of evidence contribute to constructing phylogenetic relationships:
Fossil record – traces evolutionary transitions and extinct ancestors.
Anatomical evidence – homologous structures (similar in form due to shared ancestry).
Embryological evidence – similarities in development reveal shared ancestry.
Molecular evidence – DNA and protein comparisons quantify genetic distance.
Homologous structures: Features in different organisms that share a common evolutionary origin, though their functions may differ.
Homologous structures contrast with analogous structures, which perform similar functions but evolved independently, offering evidence of convergent evolution rather than shared ancestry.
Molecular Phylogenetics and Classification
Molecular biology has revolutionised classification. The three-domain model — Archaea, Bacteria, and Eukarya — is based on ribosomal RNA (rRNA) sequences that show deep evolutionary divisions among living organisms.
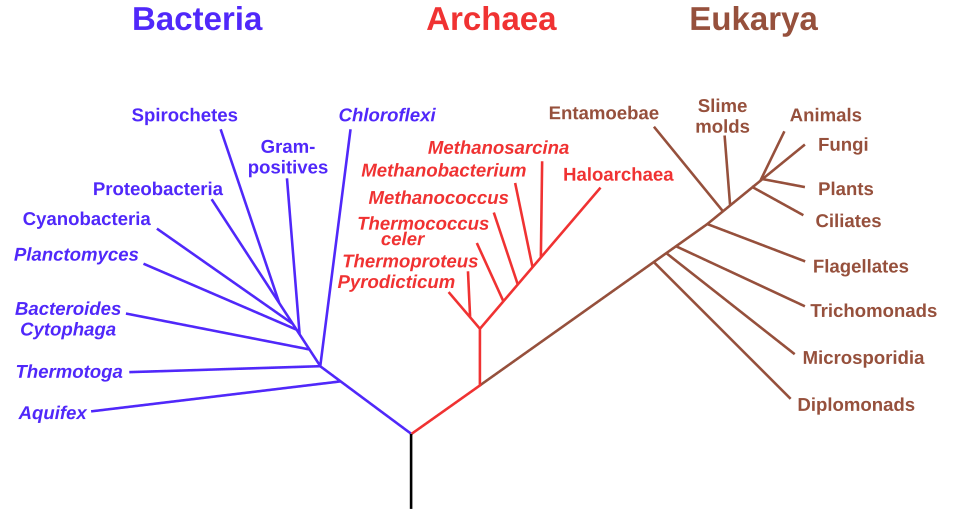
An rRNA-based phylogenetic tree of life highlighting the domains Bacteria, Archaea, and Eukaryota as proposed by Carl Woese and colleagues. It visually ties classification to molecular phylogeny by placing major lineages on a single tree. Minor fine-print labels for subgroups exceed OCR depth but aid orientation. Source.
This molecular approach ensures classification systems are not just based on appearance but accurately reflect evolutionary lineages. It has led to reclassifying certain organisms when genetic data reveal unexpected relationships.
Techniques in Molecular Analysis
DNA sequencing – reveals base pair similarities and differences.
Molecular clocks – estimate divergence times based on mutation rates.
Bioinformatics – computational tools used to compare vast amounts of genetic data.
These techniques have provided new insights into evolutionary patterns and allowed scientists to refine taxonomy continually.
The Evolutionary Basis of Modern Classification
In modern biology, taxonomy and phylogeny are inseparable. Classification now serves as a map of evolutionary history, where:
Kingdoms, phyla, and classes reflect major evolutionary divergences.
Genera and species show more recent evolutionary changes.
Every taxonomic unit corresponds to a node or branch in a phylogenetic tree.
Thus, understanding classification through the lens of phylogeny transforms it from a static list of names into a dynamic record of life’s evolutionary journey, connecting all organisms through shared ancestry and descent.
Practice Questions
Question 1 (2 marks)
Explain the difference between a monophyletic and a polyphyletic group in phylogenetic classification.
Mark Scheme:
1 mark for stating that a monophyletic group includes a common ancestor and all its descendants.
1 mark for stating that a polyphyletic group includes species from different ancestors and does not include their most recent common ancestor.
Question 2 (5 marks)
Describe how modern molecular evidence has influenced biological classification systems. In your answer, refer to how this evidence has changed our understanding of evolutionary relationships.
Mark Scheme:
1 mark for recognising that DNA, RNA, or protein sequence comparisons are used in molecular classification.
1 mark for explaining that similarities and differences in genetic sequences indicate how closely related organisms are.
1 mark for describing that this evidence has revealed previously unrecognised evolutionary relationships or corrected errors from morphology-based classification.
1 mark for referencing the three-domain model (Archaea, Bacteria, Eukarya) developed from ribosomal RNA evidence.
1 mark for explaining that molecular evidence has made classification more accurate and reflective of evolutionary history (phylogeny).
FAQ
Homologous structures share a common evolutionary origin, even if their functions differ (e.g., a whale’s flipper and a bat’s wing). These indicate shared ancestry and are used to infer phylogenetic relationships.
Analogous structures perform similar functions but arise through convergent evolution, not common ancestry (e.g., wings of insects and birds). They do not provide reliable evidence of close evolutionary relationships and can mislead classification if used alone.
Molecular clocks estimate evolutionary divergence times by assuming that mutations accumulate at a relatively constant rate over time.
Scientists compare DNA or protein sequence differences between species.
The greater the number of differences, the longer ago the species diverged.
Calibration is done using known fossil dates to translate mutation rates into absolute time estimates.
This technique refines phylogenetic trees and helps trace when lineages split during evolution.
Phylogenetic trees are hypotheses that evolve with new evidence. As molecular data and analytical methods improve, relationships once inferred from physical traits may be corrected or redefined.
Revisions occur when:
Genomic data contradict morphological assumptions.
New species or fossil discoveries add missing links.
Statistical models or computational tools improve accuracy.
Revising trees ensures they remain the most accurate reflection of evolutionary history.
The three-domain model emerged after Carl Woese’s analysis of ribosomal RNA sequences showed that prokaryotes were not a single group.
Woese discovered that Archaea were as genetically distinct from Bacteria as they were from Eukaryotes. This led to a new top-level division of life into:
Bacteria
Archaea
Eukarya
This model replaced the older five-kingdom system and better represents deep evolutionary divergence based on molecular data.
Building accurate trees from molecular evidence involves several complexities:
Horizontal gene transfer in microbes can blur lineage boundaries.
Convergent molecular evolution may produce similar genetic sequences in unrelated species.
Incomplete or biased sampling of DNA sequences limits comparisons.
Rate variation — mutation rates differ across genes and species.
To overcome these issues, scientists use multiple genes, sophisticated statistical models, and large genomic datasets to infer more robust evolutionary relationships.
