
AP Syllabus focus:
‘Use numerical tables with x-values approaching a number from both sides to estimate the limit of a function, focusing on whether the function values appear to approach a single number.’
Using tables to estimate limits helps students see how function values behave near a point and whether those values settle toward a single number that represents the limit.
Understanding Numerical Approaches to Limits
Numerical tables provide a structured way to observe how a function behaves as x approaches a target value. Because limits describe nearby behavior rather than exact function values, tables allow us to focus on trends rather than isolated points. This aligns with the syllabus emphasis on examining x-values approaching from both sides to determine if function outputs appear to converge.
A table supports the essential question of limits: What value does the function approach? By organizing values systematically, students can identify emerging patterns and determine whether a single limit is reasonable.
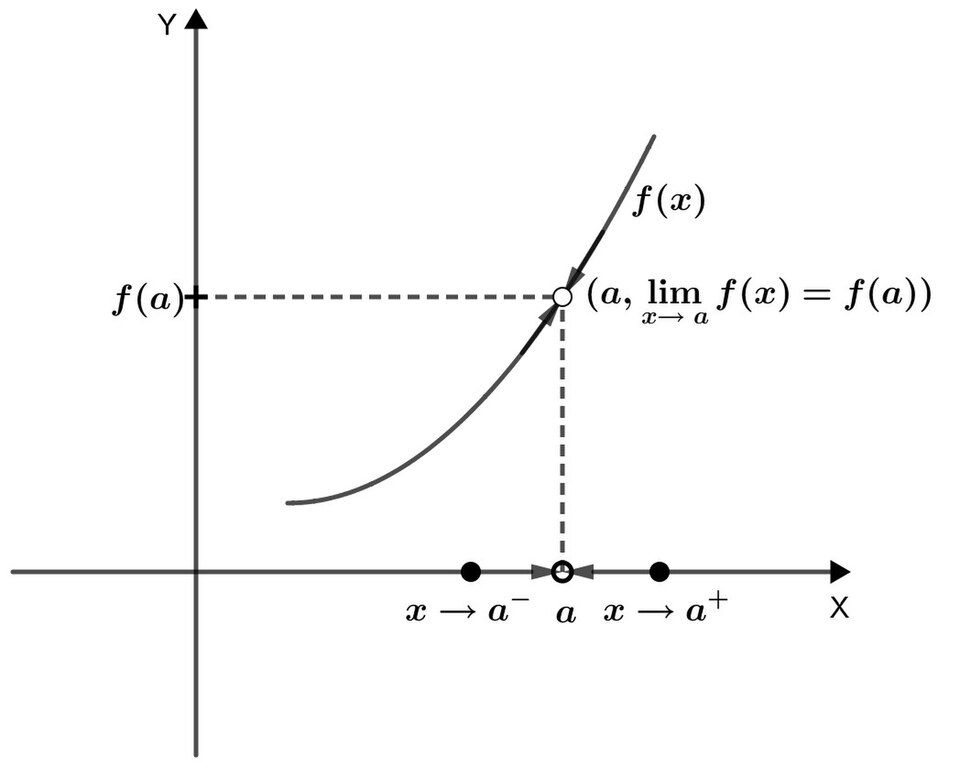
This graph illustrates how a function’s values approach a particular height as the input nears a given x-value, reinforcing how tables reveal similar convergence numerically. Source.
What It Means to Estimate a Limit from a Table
When estimating a limit numerically, we evaluate the function at values of x increasingly close to a chosen number c. The goal is to detect whether the corresponding f(x) values approach a single predictable value. If a stable trend appears from both sides of c, the limit likely exists and equals that value.
Limit of a function (informal): The value a function’s outputs approach as the input gets arbitrarily close to a specific number c, without requiring the input to equal c.
By using a table rather than relying solely on algebra, students gain an accessible way to visualize this approach behavior numerically. It is particularly helpful when algebraic simplification is difficult or when a function is not expressed in a form that allows direct substitution.
Constructing an Effective Table of Values
A well-designed table allows students to observe the left-hand and right-hand behavior of a function near a given point. To do this effectively:
Choosing x-values
• Select values decreasing toward c from the left (e.g., 2.0, 1.9, 1.99, 1.999).
• Select values increasing toward c from the right (e.g., 2.0, 2.1, 2.01, 2.001).
• Ensure values become progressively closer to c to reveal any convergence trend.
Recording function outputs
• Compute the function value f(x) for each selected x.
• Observe the pattern horizontally and vertically within the table.
• Look for familiar clustering—function values gathering around a single number.
Interpreting table behavior
• If the values from both sides converge to the same number, that number is the estimated limit.
• If they diverge, oscillate, or show no stabilizing behavior, the limit may not exist.
Left-Hand and Right-Hand Behavior in Tables
Because a limit requires both sides to agree, it is essential to examine the function's behavior from each direction separately before forming a conclusion.
Left-hand limit: The value a function approaches as x approaches c from values less than c.
A sentence must intervene here to maintain required spacing and structure.
Right-hand limit: The value a function approaches as x approaches c from values greater than c.
When both left-hand and right-hand values move toward the same numerical output, the limit at c exists.
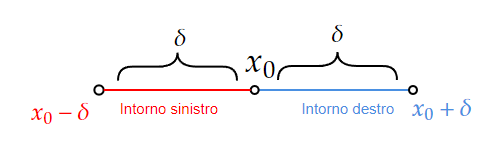
This diagram highlights how inputs can approach a single point from both directions, reinforcing the numerical requirement that table values converge from the left and right to the same limit. Source.
Identifying Convergence Patterns
Students should focus on whether numerical outputs show consistent, narrowing behavior toward a single number. Patterns worth noticing include:
Stable convergence
• Numbers approach a fixed constant from both sides.
• The values may differ at first but gradually tighten into a narrow band around the limit.
Directional approach
• Values may approach the target from above or below, revealing monotonic behavior.
• Even if the path differs, a shared destination signal supports the existence of a limit.
Apparent instability
• Values may oscillate or drift; this warns that a limit may not be present.
• Extreme fluctuations or contradiction between sides suggests further investigation is needed.
Avoiding Misinterpretations
Tables are powerful but not foolproof. Students should be aware of the following issues to avoid inaccurate conclusions:
Rounding and calculator limitations
• Calculators may round values prematurely, especially near undefined points.
• Tiny differences may be lost due to lack of precision, masking actual behavior.
Incomplete resolution
• If x-values are not close enough to c, the table may misleadingly suggest divergence or irregularity.
• Using a wider range and gradually tightening around c improves clarity.
Overreliance on numeric patterns
• A table suggests but does not prove a limit.
• Numerical evidence must be considered alongside conceptual understanding.
Using Tables Strategically in AP Calculus AB
Although tables provide intuitive and numerical insight, they are used primarily for estimation, not exact evaluation. Their strategic role includes:
• Offering a numeric perspective when algebra is difficult or impossible.
• Supporting conceptual understanding of limits as approaching behavior.
• Allowing quick verification of graphical or analytic conclusions.
• Helping students recognize when a limit likely exists and what value it may be.
In AP Calculus AB, students should develop confidence interpreting numerical data by evaluating how function values behave near a point and judging whether the data meaningfully converges. Through careful construction and thoughtful interpretation of tables, they gain a reliable method for estimating limits consistent with the syllabus focus.
Practice Questions
A function g is evaluated at several x-values close to 2. The table below shows the results.
x: 1.9, 1.99, 1.999, 2.001, 2.01, 2.1
g(x): 4.1, 4.01, 4.001, 3.999, 3.99, 3.9
Using the table, estimate the limit of g(x) as x approaches 2.
(1–3 marks)
Question 1 (1–3 marks)
• 1 mark: Recognises that values approach a single number from both sides.
• 1 mark: Correctly identifies that g(x) approaches approximately 4.
• 1 mark: Clearly states the estimated limit as 4.
Total: 3 marks.
A function f is known only through the table of values shown below.
x: -0.5, -0.1, -0.01, 0.01, 0.1, 0.5
f(x): 3.8, 3.96, 3.996, 4.004, 4.04, 4.2
(a) Use the table to estimate the two-sided limit of f(x) as x approaches 0.
(b) Explain clearly, using numerical evidence from the table, whether the limit exists.
(c) State one reason why relying solely on a table might lead to an incorrect conclusion about a limit.
(4–6 marks)
Question 2 (4–6 marks)
(a)
• 1 mark: Notes that values from the left side are approaching numbers close to 4.
• 1 mark: Notes that values from the right side also approach numbers close to 4.
• 1 mark: States the estimated two-sided limit as 4.
(b)
• 1 mark: Explains that left and right values get closer to the same number.
• 1 mark: Concludes that the limit exists because the function values from both sides converge to 4.
(c)
• 1 mark: Gives a valid reason, such as rounding errors, insufficiently close x-values, or deceptive patterns in limited numerical data.
Total: 6 marks.
FAQ
There is no fixed distance required, but the values should show a clear trend when moving closer to the target number from both sides.
A reliable approach is to:
• Halve the distance to the target repeatedly.
• Check whether f(x) stabilises to the same value across successive refinements.
If the values stop changing significantly, the estimate is usually dependable.
Differences often arise from the choice of x-values and the precision of the calculations.
Sources of discrepancy include:
• Calculator rounding affecting small input changes.
• Tables that do not sample values sufficiently close to the target.
• Functions with sharp curvature making early values unreliable.
Better resolution typically reduces these inconsistencies.
Yes. A short or coarse table might misleadingly show values clustering near a number even when the true behaviour is oscillatory or divergent.
This happens when:
• The sampling interval accidentally lands on stable-looking points.
• The function’s complexity appears only at finer scales.
Using a broader and finer set of x-values helps uncover hidden behaviour.
Compare patterns on each side separately.
If left-hand values and right-hand values approach:
• The same number — the two-sided limit likely exists.
• Different numbers — the two-sided limit does not exist.
• No stable number — the function may oscillate or grow without bound.
The distinction becomes clearer when each side’s values are assessed independently.
Fluctuation may indicate numerical instability or an inherent feature of the function.
Try the following:
• Increase calculator precision or use exact arithmetic if possible.
• Sample points slightly further out to check whether the instability is local.
• Examine whether values drift upward, downward, or alternate irregularly.
If instability persists across multiple scales, the limit may not exist.
