
AP Syllabus focus:
‘Understand that variation in data may be random or have a pattern. Recognize that due to variability, conclusions drawn from data are uncertain and should be treated as such. Variability is a fundamental concept in statistics that affects the conclusions we can draw from data.’
Understanding variability is essential in statistics because data rarely behave identically across observations. Recognizing patterns, randomness, and uncertainty helps us analyze data meaningfully and responsibly.
Understanding Variability in Data
Variability refers to the degree to which data values differ from one another.
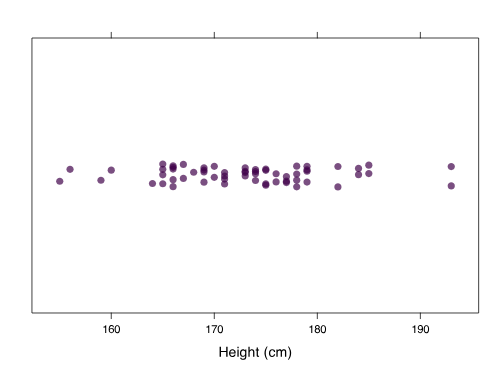
This horizontal dot plot displays individual heights, illustrating how variability appears as differences between observations. Clustering shows typical values while the spread reflects variation across the dataset. Source.
In any real-world dataset, observations naturally vary, and this variation influences what statisticians can conclude. Because the AP Statistics curriculum emphasizes interpreting data in context, recognizing the sources and nature of variability is a foundational skill.
Why Variability Matters in Statistics
Variability determines how confidently we can make claims based on data. When data exhibit substantial variation, it becomes harder to reach firm conclusions; when variation is low, patterns may be easier to detect. Understanding what causes variability, and whether that variability is meaningful or simply random, guides responsible statistical reasoning.
Types of Variability
Variability does not arise from a single mechanism. In practice, statisticians distinguish between random variability and systematic variability, each influencing data interpretation differently.
Random Variability
Random variability occurs when differences between observations arise purely by chance. Each outcome is unpredictable on its own, but collectively these outcomes follow broader tendencies. Randomness appears in many contexts, such as natural biological differences, unpredictable environmental fluctuations, and measurement noise.
Random Variability: Variation in data that arises from chance processes, producing unpredictable individual outcomes but stable long-run patterns.
Although random variability cannot be eliminated, it can be described, modeled, and quantified, making it central to statistical analysis.
Systematic Variability
Systematic variability arises when consistent factors introduce predictable differences into the data.

This four-panel diagram compares accuracy and precision, showing how systematic shifts and random scatter contribute to different patterns of variability. Tight clusters offset from the center illustrate systematic variability, while dispersed patterns highlight random variability. Source.
These factors might include consistent measurement bias, group differences, or external conditions that affect all observations in similar ways.
Systematic Variability: Variation in data caused by identifiable and consistent influences that create predictable patterns across observations.
Normal descriptive sentences belong here to maintain the required separation before any additional blocks appear.
Recognizing That Conclusions Are Uncertain
The syllabus stresses that conclusions drawn from data are never absolute. Because data always contain some variability—random or patterned—statistical conclusions are subject to uncertainty. When the same process is repeated, results will not be identical, and this has important implications. Analysts must acknowledge uncertainty and avoid overstating claims.
Uncertainty and Statistical Reasoning
Uncertainty influences every stage of statistical analysis. It affects:
how confidently we generalize findings,
how we assess the strength of patterns,
how we determine whether a result is meaningful or likely due to chance,
how we justify conclusions using appropriate evidence.
Recognizing uncertainty helps prevent misinterpretation. Even strong patterns require cautious interpretation if variability is high or if the data were collected under imperfect conditions.
Sources of Variability
To interpret data responsibly, statisticians identify the different sources of variability influencing observed values. Common sources include:
Natural Differences Among Individuals
Many variables differ naturally from one individual to another. Biological traits, behaviors, and preferences vary widely, and this inherent diversity generates substantial variation in data.
Measurement Error
Measurements may be imprecise due to limitations in instruments, human error, or recording issues. Even small inaccuracies accumulate and contribute to overall variability.
Environmental or Situational Differences
External conditions—time of day, location, weather, or equipment settings—can produce differences in outcomes. When these conditions change unpredictably, they introduce additional variability.
Sampling Variability
When data come from a sample rather than an entire population, variability arises simply because each sample contains a different subset of individuals. Sampling variability is a core concept that affects all inferential methods.
These sources may interact, overlap, or operate simultaneously, making it important to distinguish between chance-based variation and variation arising from real, meaningful differences.
Patterns Versus Randomness
A major goal of data analysis is determining whether an observed difference represents a genuine pattern or merely random noise. Variability that follows a pattern can reveal relationships, trends, or structural features in the data. Variability arising from randomness offers no explanatory insight, though it must still be accounted for when interpreting results.
Identifying Patterns in Data
Patterns may appear as:
consistent differences between groups,
visible trends in a distribution,
clustering of values around certain points,
differences in variability across conditions.
Detecting these patterns requires appropriate graphical and numerical tools. However, even when patterns appear strong, analysts must consider whether they could plausibly arise by chance.
Variability as a Core Concept in Statistical Thinking
Because variability affects every dataset, it shapes how statisticians interpret and communicate findings. Recognizing variability leads to more accurate descriptions, more careful comparisons, and more reliable conclusions. It is fundamental to the AP Statistics course because it underlies the logic of inference, the interpretation of distributions, and the need to evaluate uncertainty throughout the data analysis process.
FAQ
Instrument-related variability usually appears as small, consistent fluctuations across repeated measurements, regardless of the true value.
Variability arising from the quantity itself often increases when conditions change or when the system being measured naturally fluctuates.
To distinguish them, compare results using:
Multiple instruments
Different observers
Repeated trials under controlled versus varied conditions
Consistent differences between instruments point to instrument-based variability rather than natural variation.
No. Even in highly controlled laboratory environments, all measurements retain some degree of variability due to fundamental limits of equipment, materials and human operation.
What can be done is to minimise and quantify variability through:
High-precision equipment
Careful calibration
Consistent measuring procedures
The goal is not elimination but reducing variability enough to make reliable, defensible conclusions.
Repeated measurements provide a clearer picture of how much a quantity fluctuates under the same conditions.
With more trials:
Random variations tend to average out
Patterns or irregularities become easier to spot
Unusual values are easier to identify and evaluate
A larger set of measurements allows for more reliable estimates of the true value and better insight into the sources of variability.
Small changes in the environment can subtly affect physical quantities, especially in sensitive measurements.
Common influences include:
Temperature changes altering material dimensions
Air currents affecting timing or motion
Humidity influencing electrical or mechanical properties
Even slight shifts can accumulate across trials, introducing detectable variability that must be accounted for when interpreting results.
Systematic variability can be reduced by identifying and removing consistent biases in the setup.
Useful steps include:
Calibrating measuring instruments before use
Ensuring measurement zeroing is correct
Keeping experimental conditions as uniform as possible
Using the same measurement technique for all trials
These actions help ensure that repeated measurements vary only due to natural or random influences rather than preventable sources of bias.
Practice Questions
(1–3 marks)
A set of repeated measurements of the length of a metal rod shows small differences each time, even though the same instrument and method were used.
Explain what is meant by variability in measurements and state one possible source of this variability.
States that variability refers to differences in measured values when the same quantity is measured repeatedly. (1 mark)
Mentions that these differences arise naturally or due to uncertainty in measurement. (1 mark)
Gives one correct source of variability, e.g. reaction time, small fluctuations in conditions, or minor instrument reading inconsistencies. (1 mark)
(4–6 marks)
A student measures the time it takes for a ball to fall from a fixed height. The measured times vary slightly from trial to trial.
(a) Distinguish between random variability and systematic variability in the student’s measurements.
(b) Describe how each type of variability could arise in this experiment.
(c) Explain why recognising variability is important when drawing conclusions from the data.
(a)
Random variability: unpredictable variations in measurements that occur by chance. (1 mark)
Systematic variability: consistent bias or shift affecting all measurements in the same direction. (1 mark)
(b)
Random variability example: human reaction time when starting or stopping a timer; slight air movement; small timing fluctuations. (1 mark)
Systematic variability example: miscalibrated timer, incorrectly measured drop height, or consistent delay in the triggering method. (1 mark)
(c)
States that recognising variability helps assess the reliability of measurements. (1 mark)
States that it ensures conclusions are treated with appropriate caution and acknowledges uncertainty in the results. (1 mark)
