
Population density and land use are critical concepts in AP Human Geography that help explain the form and function of cities. These factors influence how space is organized, how people interact with their environment, and how cities manage growth and development. Urban density shapes where people live, how they commute, the types of housing they occupy, and the infrastructure needed to support them.
What Is Population Density?
Population density is a measurement of how many people live within a specific unit of land. It is typically expressed as people per square kilometer or people per square mile. This simple calculation plays a key role in understanding how population is distributed and the demands placed on land and resources.
The formula for calculating arithmetic population density is:
Arithmetic Density = Total Population / Total Land Area
This measure is useful for getting a broad overview of how crowded a place may be, but it doesn’t account for uninhabitable areas like deserts, mountains, or lakes. Different types of density offer a deeper understanding of land use and population pressure.
Factors That Influence Population Density
Several physical, social, and economic factors influence population density:
Geographic Conditions: Fertile soil, flat terrain, and a moderate climate encourage dense populations, while harsh climates or rugged terrain limit habitation.
Economic Opportunities: Cities with industries, jobs, and commercial activity tend to attract more people.
Infrastructure: Transportation systems, access to water, and modern housing increase the capacity of a region to support dense populations.
Government Policies: Zoning laws, building regulations, and housing subsidies can increase or decrease density.
Population density varies across regions, countries, and even within the same city. Inner cities often have higher densities than suburban or rural areas.
Methods of Measuring Population Density
Understanding the different methods of measuring population density is crucial to interpreting geographic and urban data.
Arithmetic Density
Measures the number of people per unit of total land.
Formula: Total Population / Total Land Area
Simple and easy to calculate.
Useful for large-scale comparisons between countries or regions.
Limitation: Doesn’t account for uninhabitable or non-productive land.
Physiological Density
Measures the number of people per unit of arable (farmable) land.
Formula: Total Population / Arable Land Area
Reveals how much pressure a population puts on its agricultural land.
High physiological density indicates a risk of food insecurity and overuse of land.
Agricultural Density
Measures the number of farmers per unit of arable land.
Formula: Number of Farmers / Arable Land Area
Useful for examining levels of agricultural efficiency.
Low agricultural density typically reflects more advanced technology and mechanization in farming.
Measuring Urban Density
In urban geography, density needs to be understood in ways that reflect how cities actually function. Therefore, several additional methods are used.
Gross Density
Refers to the total number of people in a given area, including non-residential land like parks, roads, and industrial zones.
Formula: Total Population / Total Land Area
Offers a basic view of population concentration in a city or region.
Net Density
Considers only the land used for residential purposes.
Formula: Population / Residential Land Area
More accurately represents how crowded living areas are.
Site Density
Measures the number of housing units per unit of land.
Formula: Number of Housing Units / Land Area
Helps evaluate the intensity of residential development.
Floor Area Ratio (FAR)
Compares the total floor space of buildings to the size of the lot they occupy.
Formula: Total Floor Area of Buildings / Lot Area
A FAR of 1.0 means the floor space equals the area of the lot. A FAR of 2.0 means buildings have twice the floor space as the land area.
High FAR values are common in central business districts, while lower FAR values are typical in suburban or rural areas.
Effects of Population Density
Political Implications
In high-density areas, more voters and civic participation can lead to more representation and complex governance structures.
Governments in dense areas face higher demands for public services, infrastructure maintenance, and housing.
Economic Consequences
High density supports larger markets for businesses, encouraging economic growth.
However, land becomes more expensive, and competition for space increases.
Crowded conditions may lead to rising costs of living, particularly in housing.
Social Effects
Dense environments foster cultural exchange, diversity, and social interaction.
Yet they can also result in crowding, stress, limited privacy, and social inequality.
Patterns of Urban Land Use
Urban land is used in various ways depending on population density, income, infrastructure, and planning policies.
Residential Land Use
In high-density urban cores, housing is often in the form of:
Apartments
Condominiums
Mixed-use buildings
These units are usually small and may be shared among several people.
Rent is often high, pushing people to live in poorer neighborhoods or with multiple roommates.
Historical Example
In early 20th-century New York, the Lower East Side featured tenements, which were overcrowded and lacked basic sanitation.
Apartments often had more than 15 residents in a space under 500 square feet.
Suburbs and Exurban Areas
In suburbs, housing density is lower.
More space between buildings
Single-family homes with private yards
In exurban areas, located beyond suburbs:
Even lower population density
Mix of residential, agricultural, and open land
More dependence on personal vehicles due to limited public transportation
These patterns reflect economic status, cultural preferences, and development trends.
Bid-Rent Theory
Bid-rent theory explains how land value and willingness to pay for land vary with distance from the city center.
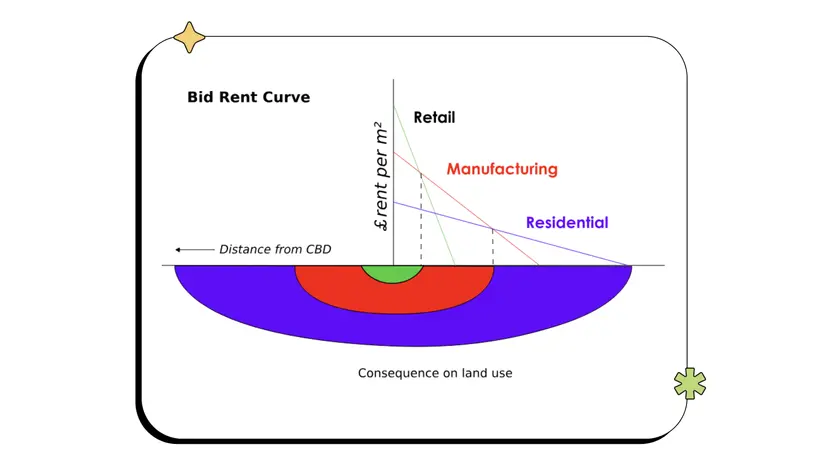
Core Idea
Land near the Central Business District (CBD) is most valuable due to:
Proximity to jobs
Centrality to services and infrastructure
Therefore:
Retail and commercial users, who benefit from customer traffic, locate near the center and pay the highest rents.
Industrial users locate slightly farther out where land is cheaper.
Residential users typically live even farther out, balancing rent with commute time.
Graphing the Bid-Rent Curve
The vertical axis represents land value or rent.
The horizontal axis represents distance from the CBD.
The curve slopes downward, showing that land value decreases with distance.
Factors That Influence the Curve
Transportation infrastructure (e.g., highways, subways)
Economic development level
Zoning and land use policies
Telecommuting and technological shifts
The theory is essential to understanding urban structure and why different types of land uses cluster in particular urban zones.
Urban Housing Conditions
High-Density Housing
Includes multi-story apartment buildings, public housing projects, and condominiums
Designed to maximize space efficiency
Common in cities with high land prices and limited room to expand
May suffer from congestion, limited green space, and increased pollution
Slum Housing
Found mostly in developing countries, slums are:
Overcrowded
Poorly built
Lacking sanitation and access to services
Slum housing emerges when urban growth exceeds infrastructure and housing supply
Tenements
Historically, these were multi-family dwellings built quickly to house laborers and immigrants.
Often had poor ventilation, unsafe structures, and unsanitary conditions
Represent early examples of the problems of unchecked urban density
Key Vocabulary and Concepts
Population Density: People per unit of land; measures concentration of population.
Arithmetic Density: Total population divided by total land area.
Physiological Density: Population divided by arable land; reveals pressure on food-producing land.
Agricultural Density: Number of farmers per arable land area; reflects farming efficiency.
Net Density: Population per area of residential land.
Gross Density: Population per total land area.
Site Density: Number of housing units per unit of land area.
Floor Area Ratio (FAR): Ratio of a building's total floor area to the size of its lot.
Bid-Rent Theory: Economic theory explaining variation in land cost by distance from the CBD.
CBD (Central Business District): Urban core of commercial and business activity.
Suburb: Residential area outside the central city; lower density.
Exurban Area: Rural-like area beyond suburbs with mixed land use.
Tenement: Overcrowded, poorly maintained multi-family urban housing.
Slum: Informal settlement with inadequate services and infrastructure.
High-Density Housing: Compact residential structures common in urban cores.
Low-Density Housing: Spacious homes typically found in suburbs or rural settings.
FAQ
Cities often promote higher-density development to use land more efficiently, reduce infrastructure costs, and minimize environmental impact. Urban sprawl increases the need for extended roads, utilities, and emergency services, which raises public spending. In contrast, compact development:
Decreases commute times and traffic congestion by concentrating housing near workplaces and transit.
Protects open space and agricultural land by limiting expansion into rural areas.
Supports public transportation systems by ensuring there’s enough ridership in concentrated zones.
Encourages mixed-use development, where residential, commercial, and recreational spaces coexist, improving walkability and reducing vehicle emissions.
This strategy aligns with sustainable urban planning goals.
Zoning laws directly shape where people live, work, and play by regulating land use types and building forms. They influence density by:
Determining how tall buildings can be or how many units are allowed per lot.
Establishing land-use categories such as residential, commercial, industrial, or mixed-use.
Requiring minimum lot sizes or setbacks that limit how densely structures can be built.
Enforcing parking minimums that reduce space available for housing or retail.
As a result, strict zoning can limit high-density development and exacerbate housing shortages, while more flexible zoning encourages infill development and a more efficient urban footprint.
Transportation systems like roads, rail lines, and subways are critical in determining where and how densely people can live. They:
Allow high-density development around transit hubs (transit-oriented development or TOD), making areas accessible without cars.
Increase the value of nearby land, incentivizing developers to build taller or more compact structures.
Enable suburban or exurban expansion by making long-distance commuting feasible.
Create corridors of development that connect central and peripheral zones, shaping urban growth direction.
In cities with well-integrated transit, people can live in smaller, denser spaces without sacrificing mobility, contributing to sustainable and inclusive urban environments.
Cultural attitudes toward housing, family size, and privacy play a major role in determining land use patterns:
In many Western societies, there’s a strong cultural preference for single-family homes and private space, promoting suburban sprawl.
In East Asian cities, smaller living spaces are accepted due to space limitations and a culture of urban compactness, resulting in high-density urban cores.
Extended family living arrangements in some cultures may lead to denser, multi-generational housing setups.
Attitudes toward communal amenities (e.g., shared courtyards, public transit) also affect land use, influencing whether vertical or horizontal expansion is favored.
Urban form reflects these preferences in tangible ways.
Land value dictates how space is used and who can afford to occupy it, making it a fundamental element in urban geography. Key reasons include:
Higher land values near city centers often result in vertical development (e.g., high-rises) to maximize return per square foot.
Low-income populations may be pushed to less desirable, lower-value areas, increasing social stratification.
Developers target areas with increasing land values for luxury housing or commercial projects, accelerating gentrification.
Cities use land value trends to determine tax revenues, infrastructure investments, and development incentives.
Understanding how and why land value fluctuates helps explain patterns in population concentration, housing types, and urban expansion.
Practice Questions
Explain how bid-rent theory influences patterns of residential land use in urban areas.
Bid-rent theory helps explain why residential areas are typically located farther from the Central Business District (CBD) in urban areas. According to the theory, land near the CBD is more expensive due to its accessibility and concentration of commercial activity. Retail and commercial businesses are willing to pay higher prices to be near the center, pushing residential land uses outward. As a result, housing in central areas tends to be more dense and expensive, while larger, lower-density homes are found in suburbs where land is cheaper. This creates a spatial pattern shaped by competition for land value.
Describe one advantage and one limitation of using arithmetic density to analyze land use in a country.
Arithmetic density, calculated by dividing a country’s population by its total land area, is useful for comparing population pressures across countries. It provides a broad overview of how populated a country is, helping identify areas that may need infrastructure or service expansion. However, a limitation is that it does not account for uninhabitable land such as mountains or deserts. This can distort perceptions of land use, as areas with high uninhabitable land may seem sparsely populated when people are actually concentrated in limited habitable zones. Therefore, it should be used alongside other density measures for a fuller understanding.
