
Urban data encompasses information collected about urban areas, guiding decisions on development, infrastructure, and policy through both quantitative and qualitative sources and methods.
Understanding Urban Data
Urban data refers to the collection, organization, and analysis of data related to cities, including their populations, infrastructure, land use, and economic and environmental systems. This data enables a deep understanding of how cities function and evolve. Urban data is crucial for:
Identifying patterns of growth and decline
Tracking demographic shifts
Evaluating policies and programs
Designing and managing infrastructure
Supporting sustainability initiatives
Urban data is gathered and used by municipal governments, national agencies, private developers, academic researchers, and nonprofit organizations. It informs policy-making, service provision, and long-term urban planning to ensure cities remain livable, efficient, and equitable.
Types of Urban Data
Urban data can be categorized into two broad types: quantitative data and qualitative data. Each type serves a unique role in providing insights into the urban environment and its people.
Quantitative Data
Quantitative data consists of information that can be counted, measured, or expressed numerically. It allows for statistical analysis and the discovery of relationships, correlations, and trends within urban systems.
Key characteristics:
Expressed in numbers
Can be analyzed using statistical techniques
Allows comparisons between places or over time
Common sources:
Censuses
Household surveys
Traffic and utility meters
Remote sensing (e.g., satellites, drones)
Administrative records (e.g., school enrollments, tax data)
Quantitative data is often used to create models, forecast urban trends, and allocate resources efficiently. It is especially useful when large-scale generalizations and consistent measurements are required.
The Census: A Primary Source of Urban Data
The census is one of the most important and comprehensive tools for collecting quantitative urban data. It is a nationwide survey conducted at regular intervals, often every 10 years, by governmental agencies to gather detailed demographic and housing information.
What census data includes:
Population count and density
Age and sex distribution
Household and family structure
Racial and ethnic composition
Income, employment, and education levels
Housing types, occupancy, and costs
Censuses are designed to be universal and standardized, making them extremely valuable for long-term comparison and national-level planning. In the U.S., the Census Bureau manages this process. Other countries, such as Canada, India, and the United Kingdom, have their own national census organizations.
Uses of census data:
Planning infrastructure such as schools, hospitals, and transportation
Distributing public funds based on population needs
Determining political representation through redistricting
Evaluating housing demand and affordability
Tracking changes in urban population over time
The data is collected using mail-in forms, phone surveys, online submissions, and in-person interviews. Digital platforms are increasingly used, improving efficiency and coverage.
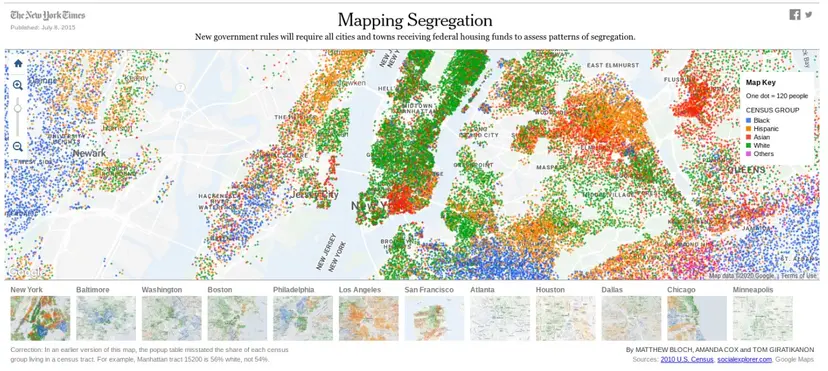
Example: Mapping Residential Segregation
Urban data, especially from censuses, can be used to map racial and economic segregation in cities. For example, using census data on race, income, and housing, researchers create spatial visualizations that show where certain groups live and how segregated different neighborhoods are.
These maps expose long-term patterns of:
Discriminatory housing policies
Redlining and disinvestment
Unequal access to education, transportation, and jobs
This information is essential for addressing urban inequality and promoting more inclusive, integrated communities. By visualizing segregation, urban planners can propose changes to zoning laws, public services, or housing subsidies to improve access and opportunity.
Qualitative Data
In contrast to numerical data, qualitative data captures descriptive, contextual, and experiential information. It focuses on how people perceive and interact with the urban environment, revealing insights that numbers alone cannot provide.
Characteristics of qualitative data:
Expressed in words, visuals, or behaviors
Captures human experiences, emotions, and meanings
Offers depth and complexity in understanding issues
Less standardized but rich in contextual information
Methods of collection:
In-depth interviews with residents, business owners, or planners
Focus groups discussing neighborhood change or urban services
Participant observation in streets, markets, or public transport
Analysis of documents, policies, and media reports
Qualitative data is often used to interpret patterns found in quantitative data. It is particularly useful when exploring new or rapidly changing issues, such as gentrification, urban resilience, or social cohesion.
Field Studies: Direct Observations in Urban Environments
Field studies involve on-site investigations of neighborhoods, communities, or infrastructure systems. These studies combine observation with interviews, photography, and note-taking to build a ground-level view of how urban areas function.
Purposes of field studies:
Document the real-world effects of urban policies
Explore the lived experiences of marginalized groups
Understand local responses to change (e.g., new transit routes or housing developments)
Examples of field studies:
Observing how residents adapt to a new bike lane or light rail station
Interviewing tenants in areas undergoing gentrification
Exploring the use of informal public spaces, like alleys or street corners
Studying the aftermath of natural disasters in urban slums
Fieldwork is essential for capturing nuances, contradictions, and informal dynamics not visible through census or survey data.
Maps as Urban Data Tools
Maps play a central role in representing both quantitative and qualitative urban data. They provide a visual understanding of spatial patterns, helping planners, researchers, and the public grasp complex issues quickly.
Types of data visualized on maps:
Population density using choropleth shading
Racial or ethnic composition through dot maps
Income levels, education attainment, or housing prices
Transit access or walkability scores
Maps are not always purely quantitative. For example, qualitative maps can depict:
Mental maps drawn by residents to show how they experience the city
Community boundaries that don’t match official zoning lines
Perceptions of safety or noise levels
Maps allow users to layer data, compare different variables, and reveal correlations, such as the overlap between poor air quality and low-income neighborhoods.
Mixed Methods: Combining Quantitative and Qualitative Data
Urban researchers and policymakers often use mixed-methods approaches that blend the strengths of both data types. This approach yields a more comprehensive picture of urban issues.
Benefits:
Quantitative data offers scale, consistency, and measurability
Qualitative data offers depth, richness, and context
Together, they support evidence-based decision-making
Example:
Suppose a city experiences declining school attendance in a particular district. A mixed-method approach would:
Use quantitative data to track attendance trends, dropout rates, and transportation access
Use qualitative data to interview parents and students about barriers (e.g., safety concerns, lack of resources, long commutes)
This holistic view helps develop targeted interventions, such as new bus routes, school meal programs, or community engagement efforts.
Applications of Urban Data
Urban data drives decisions across numerous domains. Each area benefits from the insights provided by detailed and well-analyzed information.
Urban Planning and Development
Guides zoning decisions, including mixed-use developments
Helps identify under-served areas lacking parks or clinics
Plans for future growth with population projections
Social Services and Equity
Identifies communities in need of affordable housing
Targets healthcare interventions to areas with poor outcomes
Helps track progress on diversity and inclusion goals
Transportation and Infrastructure
Monitors traffic flow, commute times, and transit use
Improves routing for public transportation
Supports smart city technologies, like real-time data on road congestion
Environment and Sustainability
Tracks waste generation, energy use, and green space
Assesses climate vulnerability (e.g., flood-prone neighborhoods)
Supports resilience planning for extreme weather events
Economic Development
Evaluates employment trends and workforce composition
Supports investment decisions in commercial zones
Monitors property values and commercial rents
Challenges in Collecting and Using Urban Data
Despite its importance, working with urban data presents several challenges:
Coverage and Accuracy
Census undercounts may miss the homeless or undocumented populations
Outdated data may not reflect rapid urban changes
Sampling biases in surveys can skew results
Ethical and Privacy Concerns
Data on income, race, or location can be sensitive
Safeguarding anonymity is critical in public datasets
There is a risk of misuse or profiling if data is not handled ethically
Technological Gaps
Not all cities have the resources for data collection and analysis
Communities without internet access may be excluded from digital surveys
Urban data systems require regular maintenance and updates
Tools and Technologies for Urban Data Analysis
A variety of technological tools are used to collect, store, analyze, and visualize urban data:
GIS (Geographic Information Systems): Allows spatial analysis and mapping
Statistical software (e.g., SPSS, R): Performs complex data analysis
Remote sensing tools: Gather satellite or drone data on land use
Open data portals: Share real-time data with the public and researchers
Urban observatories: Continuous monitoring of indicators like pollution, noise, and traffic
FAQ
Urban data platforms and dashboards offer real-time, accessible, and visual representations of key urban indicators. These digital tools allow city governments to monitor, analyze, and act on data efficiently across various departments. By consolidating large datasets—such as traffic flows, energy use, or crime rates—dashboards streamline information that would otherwise be time-consuming to process.
Dashboards support transparency and public engagement by making data easy to understand.
They help identify service gaps quickly, such as overloaded public transport lines or areas with poor emergency response times.
Real-time data can trigger immediate responses, like adjusting traffic lights based on congestion patterns.
Integrating multiple data streams allows cities to model and forecast scenarios for urban planning, disaster response, or sustainability initiatives.
These platforms enhance governance by enabling data-driven decisions, optimizing resource allocation, and promoting accountability in public administration.
Crowdsourced data involves the public contributing information—often through mobile apps, online platforms, or social media—that supplements traditional urban data sources. This bottom-up approach enhances both the depth and immediacy of urban data.
It captures dynamic, hyper-localized information like potholes, noise complaints, or public transport delays.
Mobile apps like Waze or FixMyStreet allow citizens to report traffic or infrastructure issues in real time.
Social media analysis can reveal public sentiment during urban events, protests, or emergencies.
Crowdsourced data is particularly valuable in areas where official data is limited or outdated.
Though concerns exist over accuracy and standardization, validation techniques and triangulation with official data help improve reliability. It gives planners new perspectives and fosters citizen engagement in shaping urban environments.
The digital divide—the unequal access to technology and the internet—creates gaps in urban data collection and representation, especially in lower-income or marginalized communities.
Residents without internet access may be excluded from online surveys, digital censuses, or smartphone-based data apps.
Data collected may overrepresent affluent or tech-savvy populations, skewing planning decisions and resource allocation.
Neighborhoods with poor digital infrastructure may not be visible in real-time urban monitoring systems, like smart sensors or traffic trackers.
Language barriers and digital illiteracy can further prevent residents from participating in urban data initiatives.
To address this, governments must invest in equitable digital access, provide multilingual platforms, and ensure inclusive outreach strategies. Otherwise, urban planning will reflect biased data, reinforcing existing inequalities.
Satellite imagery is a powerful tool for collecting spatial urban data, especially in rapidly changing or difficult-to-access environments. It provides an aerial view of land use, infrastructure, and environmental features across time.
Urban sprawl, deforestation, and land conversion can be monitored over time through multi-date images.
High-resolution images detect changes in informal settlements, construction activity, or green space availability.
It enables analysis of surface temperatures, flood risk zones, and pollution levels using thermal and spectral sensors.
Satellite data is especially useful in developing countries where formal data collection is limited.
Advantages include broad spatial coverage, frequent updates, and independence from ground-level surveys. However, limitations include cloud cover interference, high costs for detailed imagery, and the need for skilled interpretation using GIS software.
Urban data plays a critical role in tracking progress toward the UN’s Sustainable Development Goals, particularly Goal 11: Sustainable Cities and Communities. This goal calls for inclusive, safe, resilient, and sustainable urban environments.
Data on housing quality, infrastructure access, and public service availability informs targets for basic service provision.
Metrics such as urban air quality, green space per capita, and public transport access support environmental sustainability assessments.
Disaggregated data by income, gender, and race helps measure inequality within urban areas and guide equity-based interventions.
Urban resilience indicators—like preparedness for natural disasters or infrastructure robustness—are evaluated through geospatial and infrastructure data.
Cities that maintain robust, standardized urban data systems are better equipped to set measurable goals, monitor progress, and adjust strategies to meet the SDGs. This alignment ensures that urban development efforts contribute to global sustainability and equity.
Practice Questions
Explain how both quantitative and qualitative urban data are used together to inform urban planning decisions. Provide one example of how each type of data contributes to understanding urban issues.
Urban planners often combine quantitative and qualitative data to develop well-rounded strategies. Quantitative data, such as census statistics or housing prices, reveals patterns like population density or income distribution. Qualitative data, like interviews or field studies, provides insight into community experiences and social dynamics. For example, quantitative data might show high dropout rates in a neighborhood, while qualitative interviews explain parental concerns about school safety. Together, they guide targeted interventions. This dual approach ensures that data-driven decisions are also socially informed, resulting in more equitable and effective urban planning solutions that reflect both measurable trends and lived realities.
Describe one method used to collect urban data and evaluate its effectiveness in addressing urban social issues.
The census is a primary method for collecting urban data, offering detailed demographic, housing, and economic information. Conducted every ten years, it provides a standardized national dataset that helps governments identify disparities in housing, income, and population distribution. Its strength lies in its broad coverage and comparability across regions and time periods. However, it may miss transient or marginalized populations, leading to underrepresentation in policymaking. Despite limitations, census data is highly effective in revealing patterns of social inequality, informing funding allocation, and shaping long-term infrastructure planning, making it indispensable in addressing urban social issues and promoting equitable urban development.
