
Development is assessed through a variety of economic, social, and environmental indicators that reflect the quality of life, economic strength, and sustainability in a country. These measures help evaluate the progress of different regions and identify disparities in wealth, access, and opportunity.
Gross Domestic Product (GDP)
One of the most commonly used indicators of development is Gross Domestic Product (GDP). It measures the total monetary value of all final goods and services produced within a country’s borders in a specific period, typically over the course of one year.
GDP is an indicator of overall economic activity and the size of a nation’s economy.
A higher GDP often suggests a country has a well-developed infrastructure, advanced industry, and a large output of goods and services.
However, GDP has limitations: it does not consider income distribution, environmental degradation, or informal economic activity.
GDP per Capita
To allow for more accurate comparisons between countries of different sizes, GDP per capita is used. This figure is obtained by dividing a country’s total GDP by its population.
Formula: GDP per capita = GDP ÷ Total Population
This measure represents the average economic output per person, offering a clearer view of living standards than GDP alone.
However, it is still an average and may mask economic inequality. A country could have a high GDP per capita while large segments of the population live in poverty.
Gross National Income (GNI)
Gross National Income (GNI) includes the income earned by a country's citizens and businesses, regardless of whether the income was generated domestically or abroad. It accounts for net income from abroad, such as remittances and international business profits.
Formula: GNI = GDP + (Income earned from abroad – Payments made to foreign entities)
GNI reflects the total income received by residents, capturing the global economic interactions of a country.
It is especially useful in understanding the development of countries with large diasporas, as remittances can significantly boost GNI.
GNI per Capita
Similar to GDP per capita, GNI per capita divides the total GNI by the population:
GNI per capita = GNI ÷ Total Population
This measure is widely used by the World Bank and UNDP to classify countries into income groups: high-income, upper-middle-income, lower-middle-income, and low-income.
GNI per capita provides a broad picture of economic well-being and is used to track progress over time.
Human Development Index (HDI)
The Human Development Index (HDI) is a composite statistic created by the United Nations Development Programme (UNDP) to assess overall human development. It includes three key dimensions:
Health – measured by life expectancy at birth
Education – measured by mean years of schooling and expected years of schooling
Standard of Living – measured by GNI per capita (PPP)
HDI values range from 0 to 1, with higher numbers indicating greater development.
Countries are grouped into four categories: Very High, High, Medium, and Low human development.
HDI offers a more balanced measure than GDP or GNI alone by incorporating education and health.
However, HDI does not account for inequality, gender disparity, or environmental sustainability.
Multidimensional Poverty Index (MPI)
The Multidimensional Poverty Index (MPI) was developed to address the limitations of income-based poverty measures. It reflects the multiple deprivations that individuals face in health, education, and living standards.
Health: Nutrition, child mortality
Education: Years of schooling, school attendance
Standard of Living: Access to clean water, sanitation, electricity, housing, and cooking fuel
MPI provides a clearer picture of who is poor and why, allowing governments and organizations to target interventions more effectively.
A person is considered multidimensionally poor if they are deprived in at least one-third of the weighted indicators.
MPI is especially relevant in developing countries where poverty may not be well reflected in income alone.
Gender Development Index (GDI)
While HDI measures overall development, the Gender Development Index (GDI) was created to highlight gender inequalities. It compares the HDI scores of men and women based on:
Life expectancy
Education (mean and expected years of schooling)
Income (estimated earned income)
GDI reveals gaps in achievement between males and females and encourages gender-sensitive policies.
Countries with a low GDI may have strong economic development overall but significant gender-based disparities in education, health, and income.
The GDI promotes a more equitable approach to development and tracks progress toward gender equality over time.
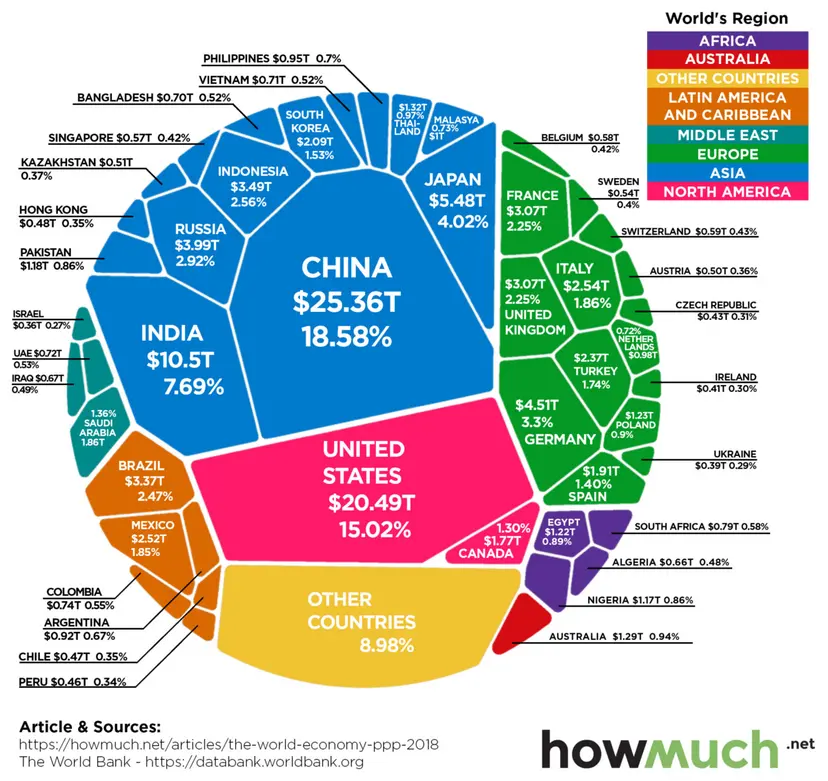
Courtesy of Howmuch
Environmental Performance Index (EPI)
The Environmental Performance Index (EPI) evaluates how well countries manage their natural environments. It focuses on both environmental health and ecosystem vitality.
Key categories include:
Air and water quality
Biodiversity and habitat
Climate change mitigation
Forest and fisheries management
Agriculture impacts
EPI scores are derived from multiple data points, producing an overall ranking.
Countries with high EPI scores are seen as environmentally progressive and more likely to support sustainable development.
EPI connects environmental protection directly to a country’s long-term prosperity and resilience.
Per Capita Calculations
Per capita measurements are critical for comparing countries and assessing the average access to resources or wealth. These figures allow analysts to normalize statistics for different population sizes.
Examples of per capita calculations include:
GDP per capita
GNI per capita
Energy use per capita
CO₂ emissions per capita
Advantages of per capita measures:
Provides a sense of individual impact or benefit
Useful for international comparisons
Highlights inequities in resource distribution
Limitations:
Per capita figures are averages and do not reveal the distribution of income or resources.
A high per capita income may still coexist with extreme poverty among certain groups.
Trade Deficits
A trade deficit occurs when the value of a country’s imports exceeds the value of its exports. This results in a negative balance of trade.
Formula: Trade Balance = Exports – Imports
If this value is negative, the country has a trade deficit.
Impacts of trade deficits:
Can lead to currency depreciation as demand for foreign currency increases.
May result in loss of domestic jobs if imports replace locally-produced goods.
Can cause national debt to rise if financed by borrowing from abroad.
However, not all trade deficits are negative:
A country with a strong service sector or high investment levels might run a deficit while still maintaining economic health.
Persistent deficits may indicate structural economic issues, while temporary deficits can support growth during periods of expansion.
Health and Social Indicators
Beyond economic measures, health and education indicators provide insight into quality of life and human development.
Life Expectancy
The average number of years a newborn is expected to live, assuming current mortality rates remain constant.
Influenced by:
Nutrition
Healthcare access
Sanitation
Public health infrastructure
High life expectancy suggests a high level of development and effective health systems.
Infant Mortality Rate (IMR)
The number of infant deaths per 1,000 live births in a given year.
High IMR reflects poor prenatal and neonatal care, malnutrition, and inadequate health services.
A low IMR is associated with higher quality of life and better healthcare availability.
Fertility Rate
The average number of children born to a woman during her reproductive years.
High fertility rates often indicate:
Low access to education, especially for women
Limited family planning
Cultural norms favoring large families
Declining fertility rates are typically linked to:
Urbanization
Economic development
Improved education levels
Literacy Rate
The percentage of people aged 15 and older who can read and write.
Literacy is a strong predictor of:
Economic productivity
Educational outcomes
Civic participation
High literacy rates support higher levels of social and economic development.
Access to Health Care
Measures how easily individuals can obtain medical services when needed.
Influenced by:
Distance to clinics and hospitals
Availability of medical staff and equipment
Affordability and insurance coverage
Access to healthcare is fundamental to reducing mortality and improving life expectancy.
Formal and Informal Economies
The structure of a country’s economy plays a major role in its development indicators.
Formal Economy
Regulated by the government
Includes businesses that are:
Licensed
Tax-paying
Offering legal protections and benefits to employees
Contributes to official GDP and GNI calculations
Associated with higher economic security, legal standards, and worker protections
Informal Economy
Not regulated or taxed by the government
Examples include:
Street vendors
Unregistered small businesses
Day laborers
Often emerges in areas where formal employment is limited
May provide vital income for individuals, but offers no legal protections, and is not included in formal development statistics
A large informal sector may signal underdevelopment, weak governance, or economic instability
Countries with larger formal sectors generally show higher development levels, while those with expansive informal economies often struggle with poverty, inequality, and weak
FAQ
Purchasing Power Parity (PPP) adjustments are essential in comparing development levels more accurately across countries because they account for differences in the cost of living and inflation rates. GDP or GNI values converted simply using market exchange rates can distort true living standards, as the same amount of money can buy vastly different quantities of goods and services in different countries. PPP adjusts for these disparities by comparing how much a standard basket of goods costs in each country.
Helps correct for currency value distortions.
Reflects local economic realities more accurately.
Makes development data like GNI per capita more meaningful for comparing quality of life.
Allows for fairer comparisons between developed and developing countries.
Income inequality affects how the benefits of economic development are distributed among a population. A country may have a high GDP or HDI, but if wealth is concentrated in the hands of a few, most citizens may not experience improved living standards. Ignoring inequality can mask serious issues such as lack of access to education, healthcare, and employment for disadvantaged groups.
It reveals disparities within a country, not visible in per capita measures.
Unequal access to resources can slow overall development and stability.
High inequality often leads to social tension, crime, and political unrest.
Measures like the Gini Index can be used to assess income distribution and complement development data.
The dependency ratio measures the proportion of dependents (people under age 15 and over 64) to the working-age population (ages 15–64). A high dependency ratio can strain a country’s economy, as fewer workers support more non-working individuals. This affects tax revenues, social services, and economic productivity.
High youth dependency often occurs in less developed countries with high fertility rates.
High elderly dependency is more common in developed countries with aging populations.
A low dependency ratio can support economic growth if the working-age population is well-employed and productive.
Understanding this ratio helps explain healthcare, education, and pension burdens.
National development indicators can hide sharp inequalities between regions. For example, urban areas might have high education levels and healthcare access, while rural or remote areas lag significantly. These regional differences can lead to inaccurate generalizations about a country's development.
Regional disparities often reflect historical investment patterns and infrastructure availability.
Differences in employment types—industrial vs. agricultural—can also influence development outcomes.
Unequal development within a country can hinder national unity and sustainable growth.
Addressing regional disparity is key to inclusive development policies that benefit the entire population.
While quantitative indicators like GDP and life expectancy provide measurable data, qualitative indicators offer insight into the lived experiences of individuals and communities. These indicators consider aspects that numbers may not fully capture, such as political freedom, human rights, and overall life satisfaction.
Examples include:
Public perception of government effectiveness.
Levels of personal security or safety.
Accessibility of public services beyond just presence (e.g., quality of schools or clinics).
Civic participation and freedom of speech.
These indicators help explain why countries with similar economic indicators may offer vastly different qualities of life.
Including qualitative data provides a fuller understanding of what "development" means to people on the ground.
Practice Questions
Explain the limitations of using Gross Domestic Product (GDP) per capita as a measure of a country's level of development.
GDP per capita is a common economic indicator used to compare development levels across countries, but it has significant limitations. It does not account for income inequality, so countries with high GDP per capita may still have large segments of the population living in poverty. It also ignores non-economic factors such as health, education, and environmental quality, which are critical to overall development. Additionally, GDP per capita excludes the informal economy and unpaid work, leading to an incomplete picture of actual living standards, especially in developing countries with large informal sectors.
Describe how the Human Development Index (HDI) provides a more comprehensive measure of development than economic indicators alone.
The Human Development Index (HDI) includes three dimensions—life expectancy, education, and income—making it a broader measure of development than economic indicators like GDP or GNI alone. HDI captures human well-being by considering health and educational access, which are essential components of quality of life. By incorporating social factors, it offers a more accurate representation of human development and allows for comparisons beyond economic output. This helps identify disparities that GDP might overlook, such as countries with high incomes but poor education or health outcomes. Therefore, HDI supports a more human-centered view of development.
