
AQA Syllabus focus:
'Correlations, including analysis of relationships between co-variables and the difference between correlations and experiments.'
Correlation studies examine whether two measured variables are linked. In AQA Psychology, you need to understand co-variables, how their relationship is analyzed, and why correlation is different from experimentation.
What is a correlation?
A correlation is an analysis of the relationship between two co-variables to see whether changes in one are associated with changes in the other.
A correlational study looks for a pattern between two measured variables. If changes in one variable are linked to changes in another, there is a correlation. The variables may move in the same direction, in opposite directions, or show no clear relationship.
Unlike an experiment, a correlation does not involve changing a variable to observe an effect. The researcher records what already exists and then examines whether the measures are related. This makes correlation especially useful when direct manipulation would be impossible, impractical, or inappropriate.
Researchers describe the two measured variables as co-variables.
A co-variable is one of the two measured variables in a correlational study.
Both co-variables are measured, not manipulated. This is why correlational research does not use the same logic as experimental research. The focus is on association, not on demonstrating that one variable produces change in another.
Analyzing relationships between co-variables
When psychologists analyze a correlation, they are looking for the direction and strength of the relationship.
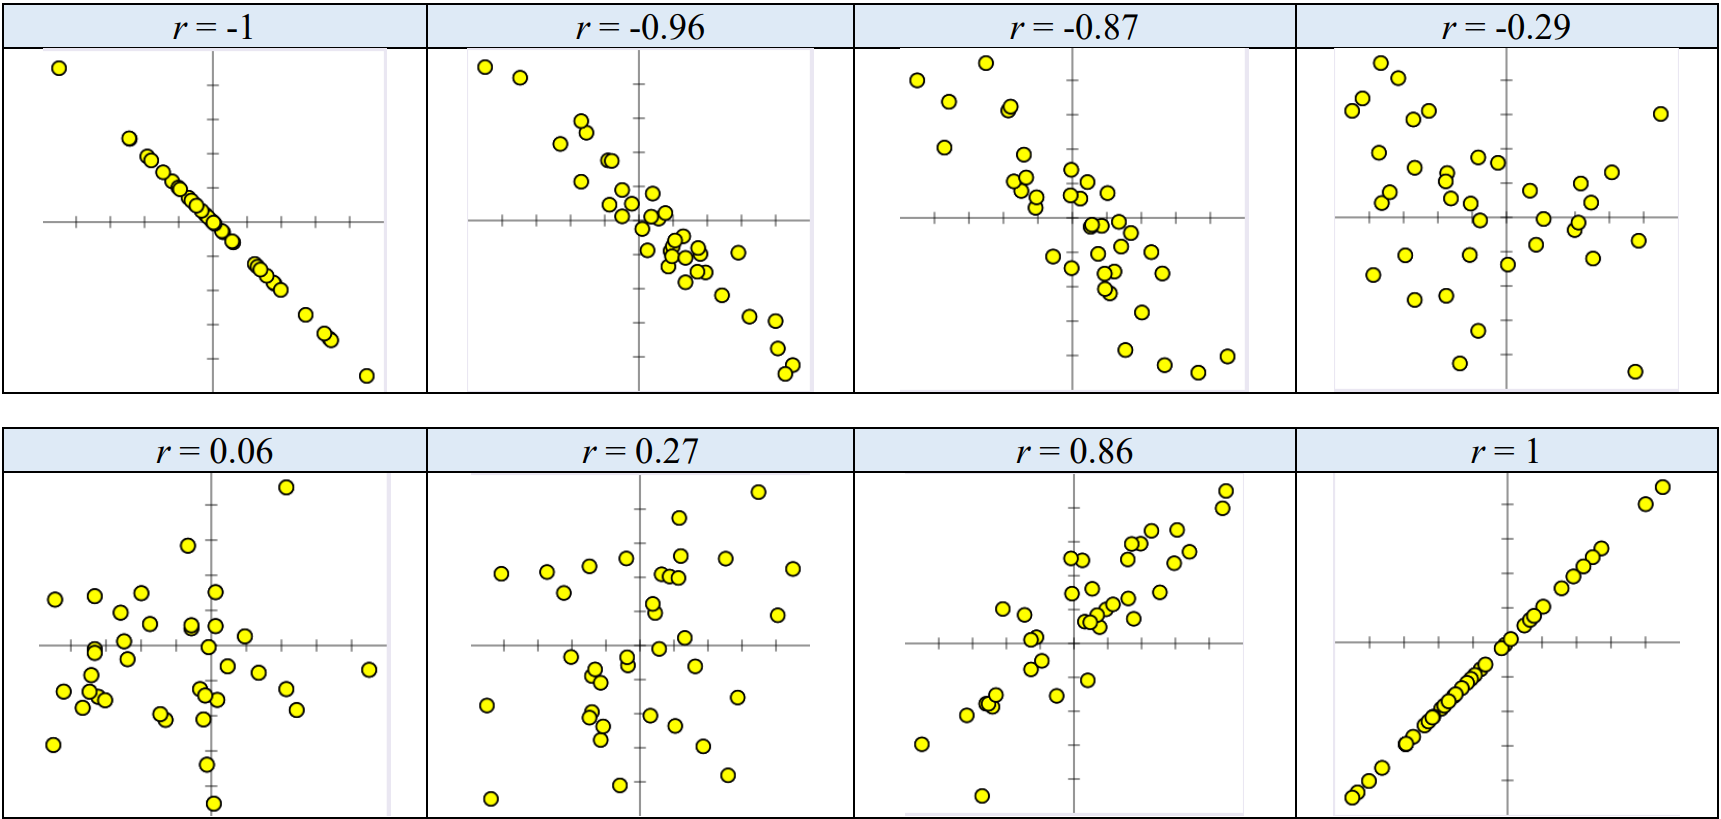
A set of scatterplots labeled with different Pearson correlation coefficients () from −1 to +1. It visually demonstrates how the sign of indicates the direction (upward vs. downward trend) and how the magnitude of reflects strength (tighter clustering around a line means a stronger correlation). Source
A positive relationship means that as one co-variable increases, the other also tends to increase.
A negative relationship means that as one co-variable increases, the other tends to decrease.
No clear relationship means there is no consistent pattern linking the two sets of scores.
The strength of a correlation refers to how closely the scores follow a clear pattern. If the relationship is strong, the pattern is obvious and the two co-variables change together in a consistent way. If it is weak, the pattern is less clear and prediction is less accurate.
Psychologists must describe the relationship carefully. A correlation does not mean that every person fits the pattern perfectly. It means there is an overall tendency in the data. A few unusual scores can make the relationship seem weaker or stronger than the general pattern suggests, so interpretation should stay cautious.
Correlations and experiments: the key difference
The main difference is that a correlation measures relationships, whereas an experiment tests effects. In a correlational study, the researcher measures two co-variables as they naturally occur. In an experiment, the researcher deliberately changes one factor and observes its impact on another.
This distinction matters because only experiments are designed to test cause and effect. Correlations can show that two variables are linked, but they cannot show which variable came first or whether one variable actually caused the other.
There are two major reasons for this:
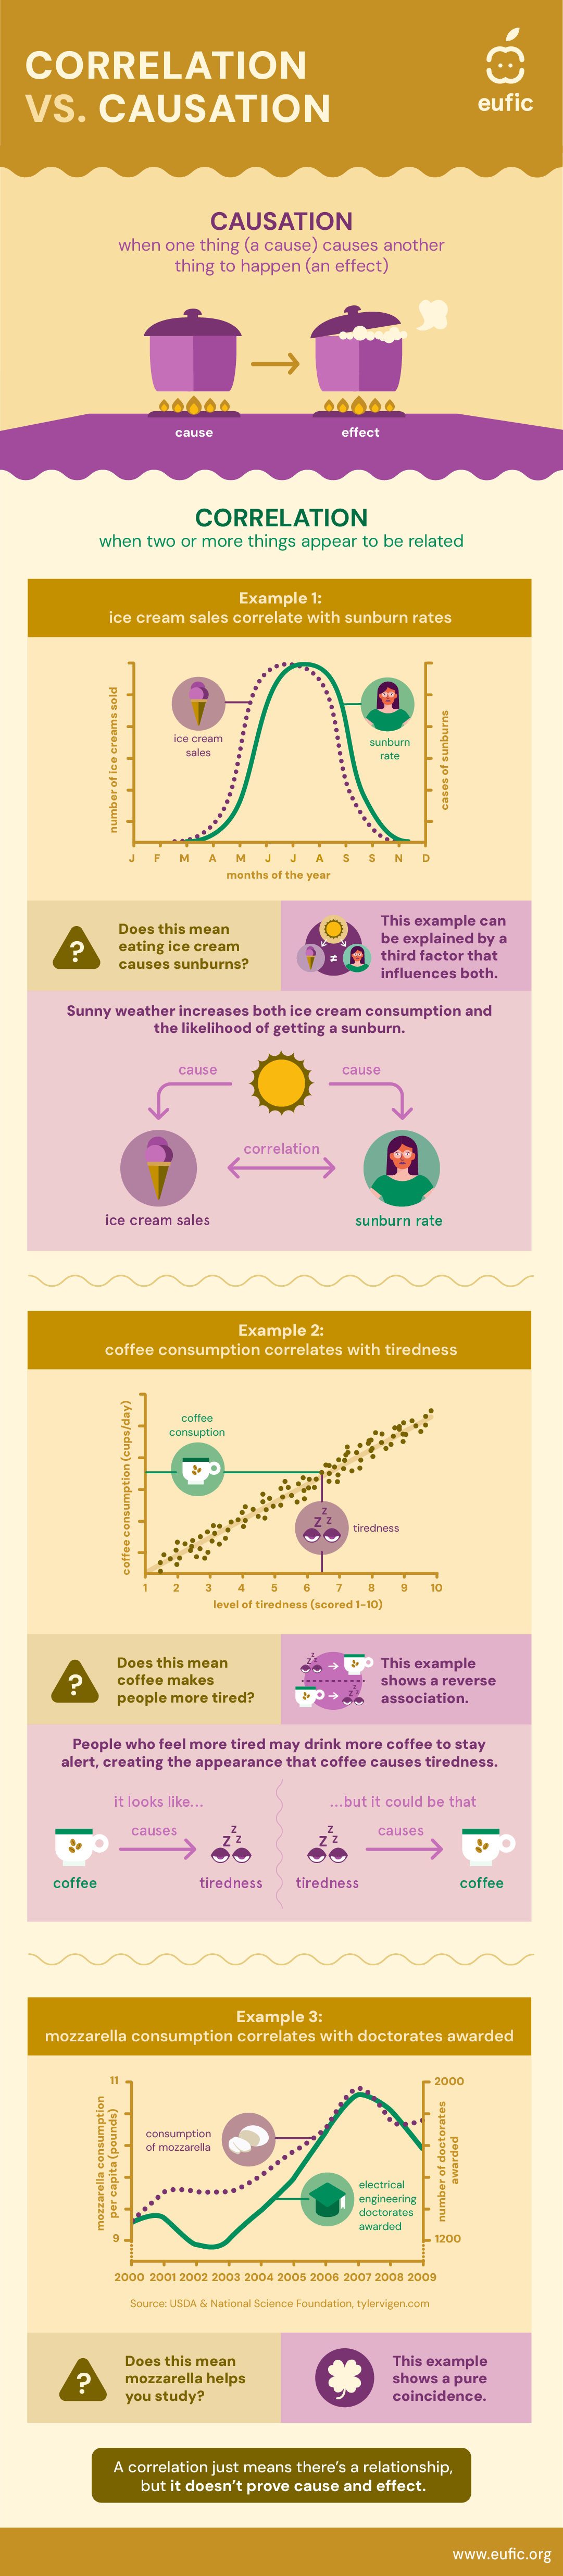
An infographic that distinguishes correlation from causation using simple examples and diagrams. It illustrates how an observed relationship can arise from reverse directionality or from a third variable influencing both co-variables, reinforcing why correlational evidence cannot justify cause-and-effect claims. Source
Directionality problem: if two variables are related, it may be unclear which one influences the other.
Third variable problem: a different, unmeasured variable may be responsible for the relationship.
For example, if anxiety and poor sleep are correlated, several interpretations are possible. Anxiety may disrupt sleep, poor sleep may increase anxiety, or another factor may affect both. The correlational method alone cannot separate these explanations.
This is why correlational findings should be reported with phrases such as is associated with, is linked to, or is related to. Causal language such as causes, produces, or leads to is not justified by correlation alone.
Why psychologists use correlations
Despite their limits, correlations are highly useful in psychology.
They allow researchers to study variables that already exist naturally.
They are useful when manipulation would be unethical, such as studying trauma or serious mental health difficulties.
They can reveal patterns that deserve further investigation.
They can help psychologists make predictions, even when a causal explanation is not available.
In many areas of psychology, identifying a reliable relationship is an important first step. A correlation can show that two variables are connected strongly enough to be worth examining in more depth through other methods.
Interpreting correlational evidence carefully
A good interpretation of correlation stays close to what the data actually show. The safest claim is that changes in one co-variable are associated with changes in another. Stronger claims go beyond the evidence.
It is also important to remember that a weak or absent correlation does not automatically prove that the variables are completely unrelated in every situation. It only shows that the study did not detect a clear overall relationship in the data collected.
For AQA Psychology, the essential points are clear: correlations analyze the relationship between co-variables, they identify patterns rather than causes, and they differ from experiments because no variable is manipulated to test an effect.
Practice Questions
Outline what is meant by a correlation study in psychology. (2 marks)
1 mark for stating that it investigates a relationship or association between two variables.
1 mark for stating that the variables are measured as co-variables rather than manipulated.
A psychologist records the number of hours of exercise each week and stress scores for a group of adults. Explain what a negative correlation would mean in this investigation and discuss two differences between a correlational study and an experiment. (6 marks)
1 mark for identifying a negative correlation as an inverse relationship.
1 mark for applying this to the stem: as exercise increases, stress scores tend to decrease, or vice versa.
Up to 2 marks for one difference, such as correlation measures two co-variables while an experiment deliberately changes one factor and measures its effect on another.
Up to 2 marks for a second difference, such as correlation cannot establish cause and effect, whereas an experiment is designed to test causal effects.
FAQ
A curvilinear relationship is one in which the pattern changes direction. For example, as one variable increases, the other may rise at first and then fall.
This matters because a simple correlation is best at detecting a straight-line relationship. A clear curved pattern can therefore appear weaker than it really is if the researcher only looks for a linear association.
Restricted range happens when the sample has very similar scores on one or both co-variables. This reduces visible variation.
For example, if a study only includes very high-performing students, it may be harder to see the true relationship between revision time and grades. A wider, more varied sample often shows the pattern more clearly.
Outliers are extreme or unusual scores that sit far away from the main pattern of data.
In correlational research, a small number of outliers can make a relationship look stronger, weaker, or even reversed. This is why researchers should check whether the overall pattern is genuine rather than being driven by a few unusual cases.
A spurious correlation is an apparent relationship between two variables that is misleading.
It may happen because of coincidence, poor measurement, or an unseen third factor affecting both variables. The pattern may look convincing at first, but it does not reflect a simple direct link between the two co-variables being studied.
Larger samples usually give a more stable picture of the relationship between co-variables. They reduce the influence of random fluctuations and unusual individual scores.
With a very small sample, the pattern may change a lot if just one or two participants are added or removed. A larger sample makes it easier to judge whether the relationship is likely to be reliable.
