Populations
Population = a group of organisms of the same species living in the same area and interacting.
Members of a population normally breed with each other.
Reproductive isolation distinguishes one population from another.
In exams, separate population from community: population = one species; community = all interacting populations.
Estimating population size
Population size is usually estimated, not counted exactly, because full counts are often impractical, slow, or impossible.
Good sampling must be random to reduce bias.
Sampling error = the difference between the estimate and the true population size.
Always link estimates to the idea that samples must be representative.
Quadrat sampling for sessile organisms
Use random quadrat sampling for sessile organisms such as plants or attached animals.
Count individuals in several randomly placed quadrats.
Calculate mean number per quadrat.
Estimate total population size using:
mean number per quadrat × total number of quadrats that fit into the habitat
Standard deviation shows how much counts vary between quadrats:
low SD = individuals are spread more evenly
high SD = distribution is patchy/clumped
Common exam point: quadrats are suitable only when organisms do not move significantly.
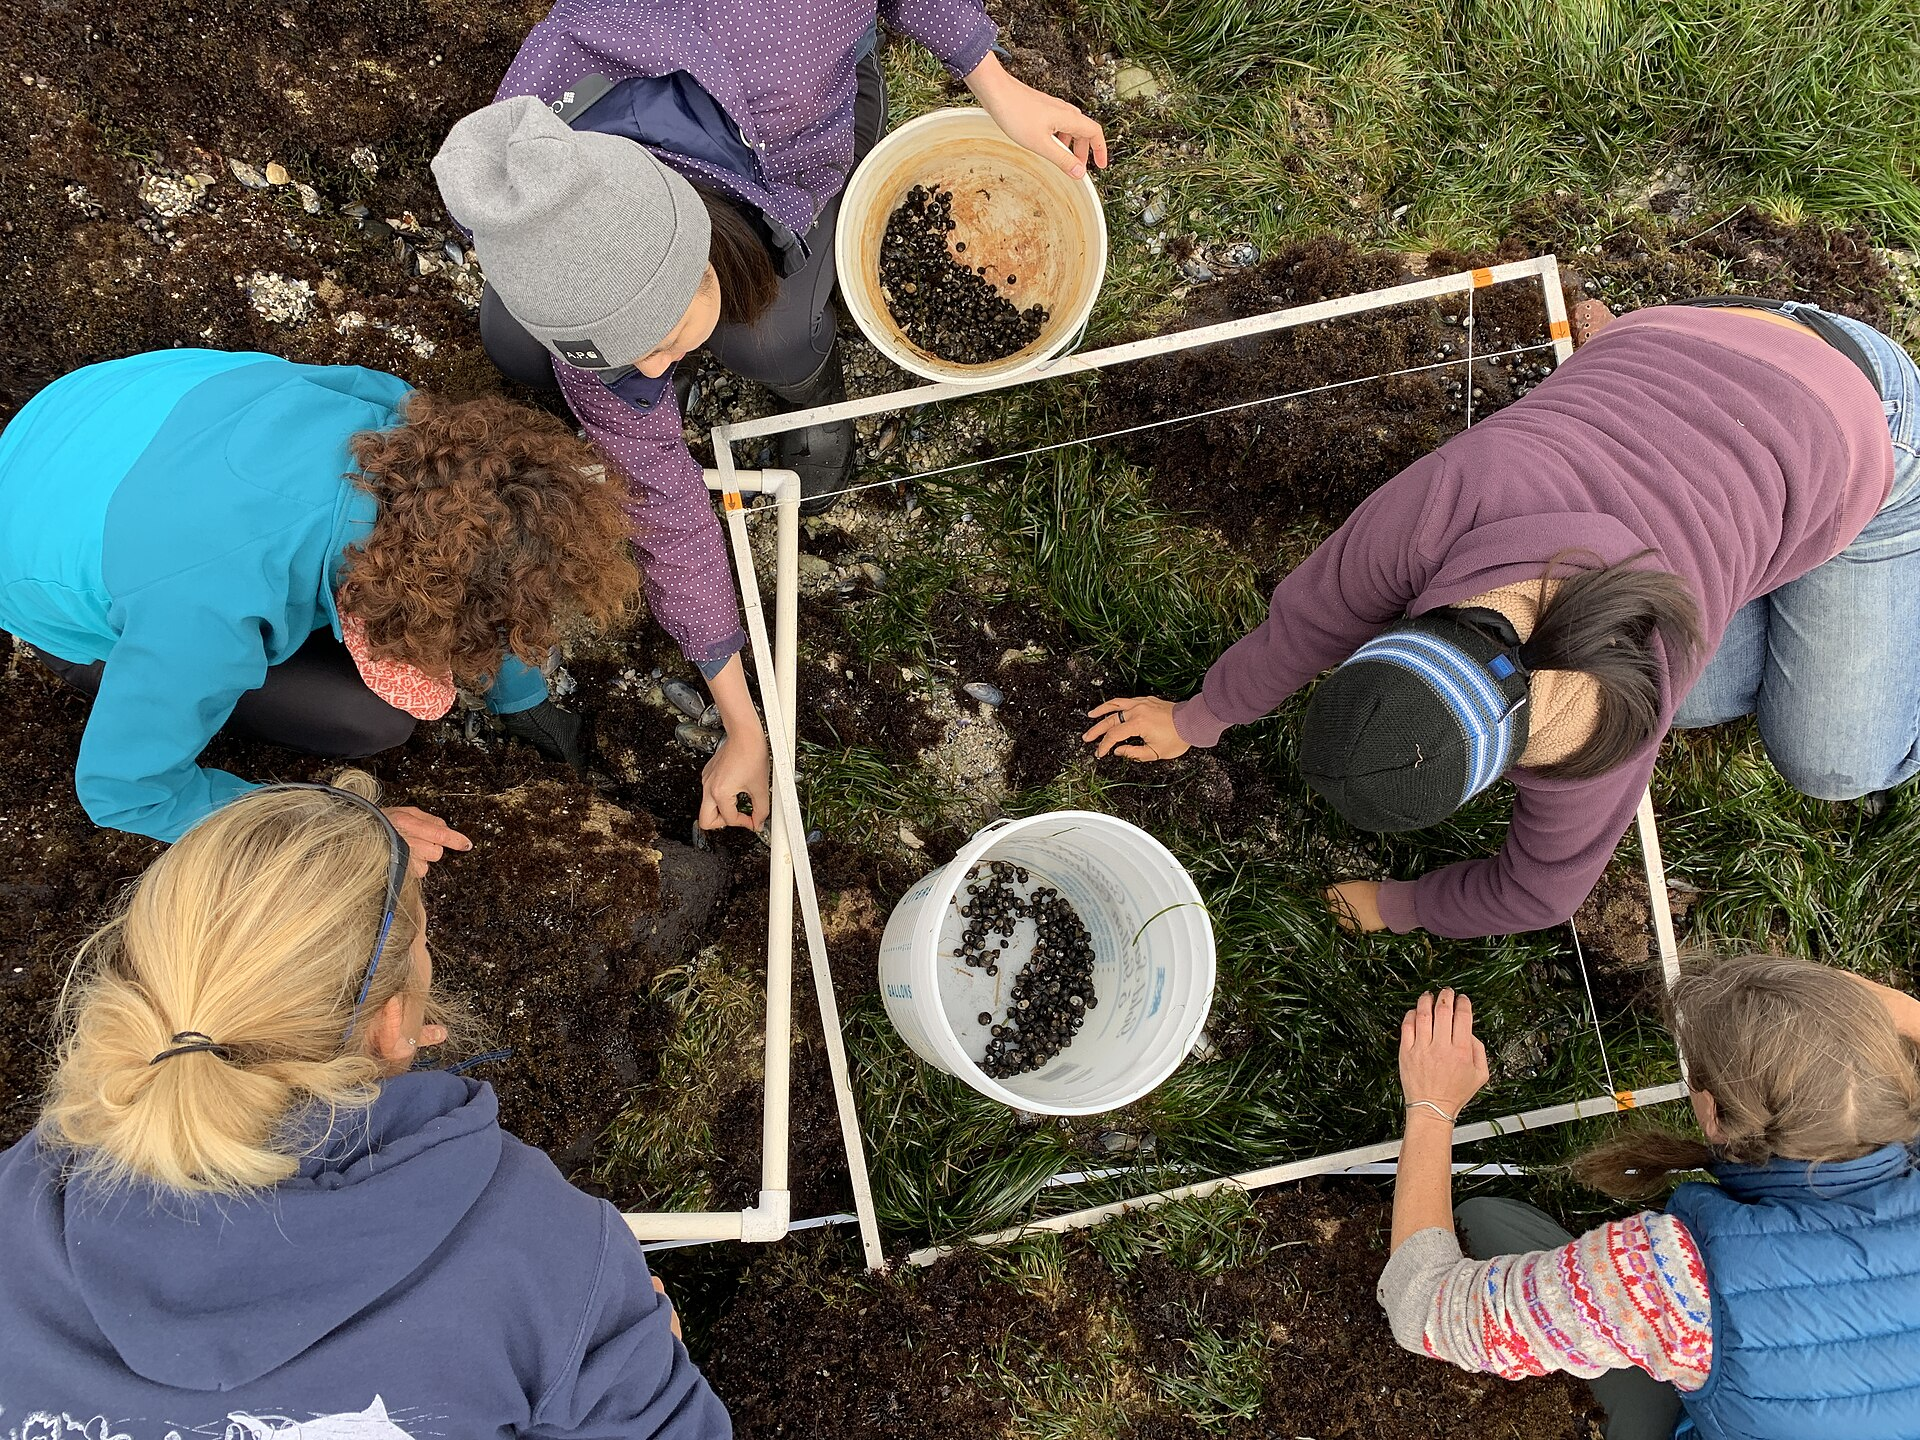
This image shows quadrat-based ecological sampling in the field. It is useful for linking random or systematic sampling to estimating abundance of sessile organisms in a defined area. A quadrat marks a known sample area so counts can be scaled up to estimate population size. Source
Capture–mark–release–recapture
Used for motile organisms.
Method:
capture a first sample and mark them
release and allow time for remixing
capture a second sample
record how many are marked recaptures
Lincoln index:
Population size estimate = (M × N) / R
M = number caught and marked first
N = total caught in second sample
R = number of marked individuals recaptured
If R is small, estimated population size becomes large.
Assumptions of the method:
marked individuals mix back into the population randomly
marks do not affect survival or behaviour
no significant births, deaths, immigration, or emigration between samples
marks are not lost
all individuals are equally likely to be captured
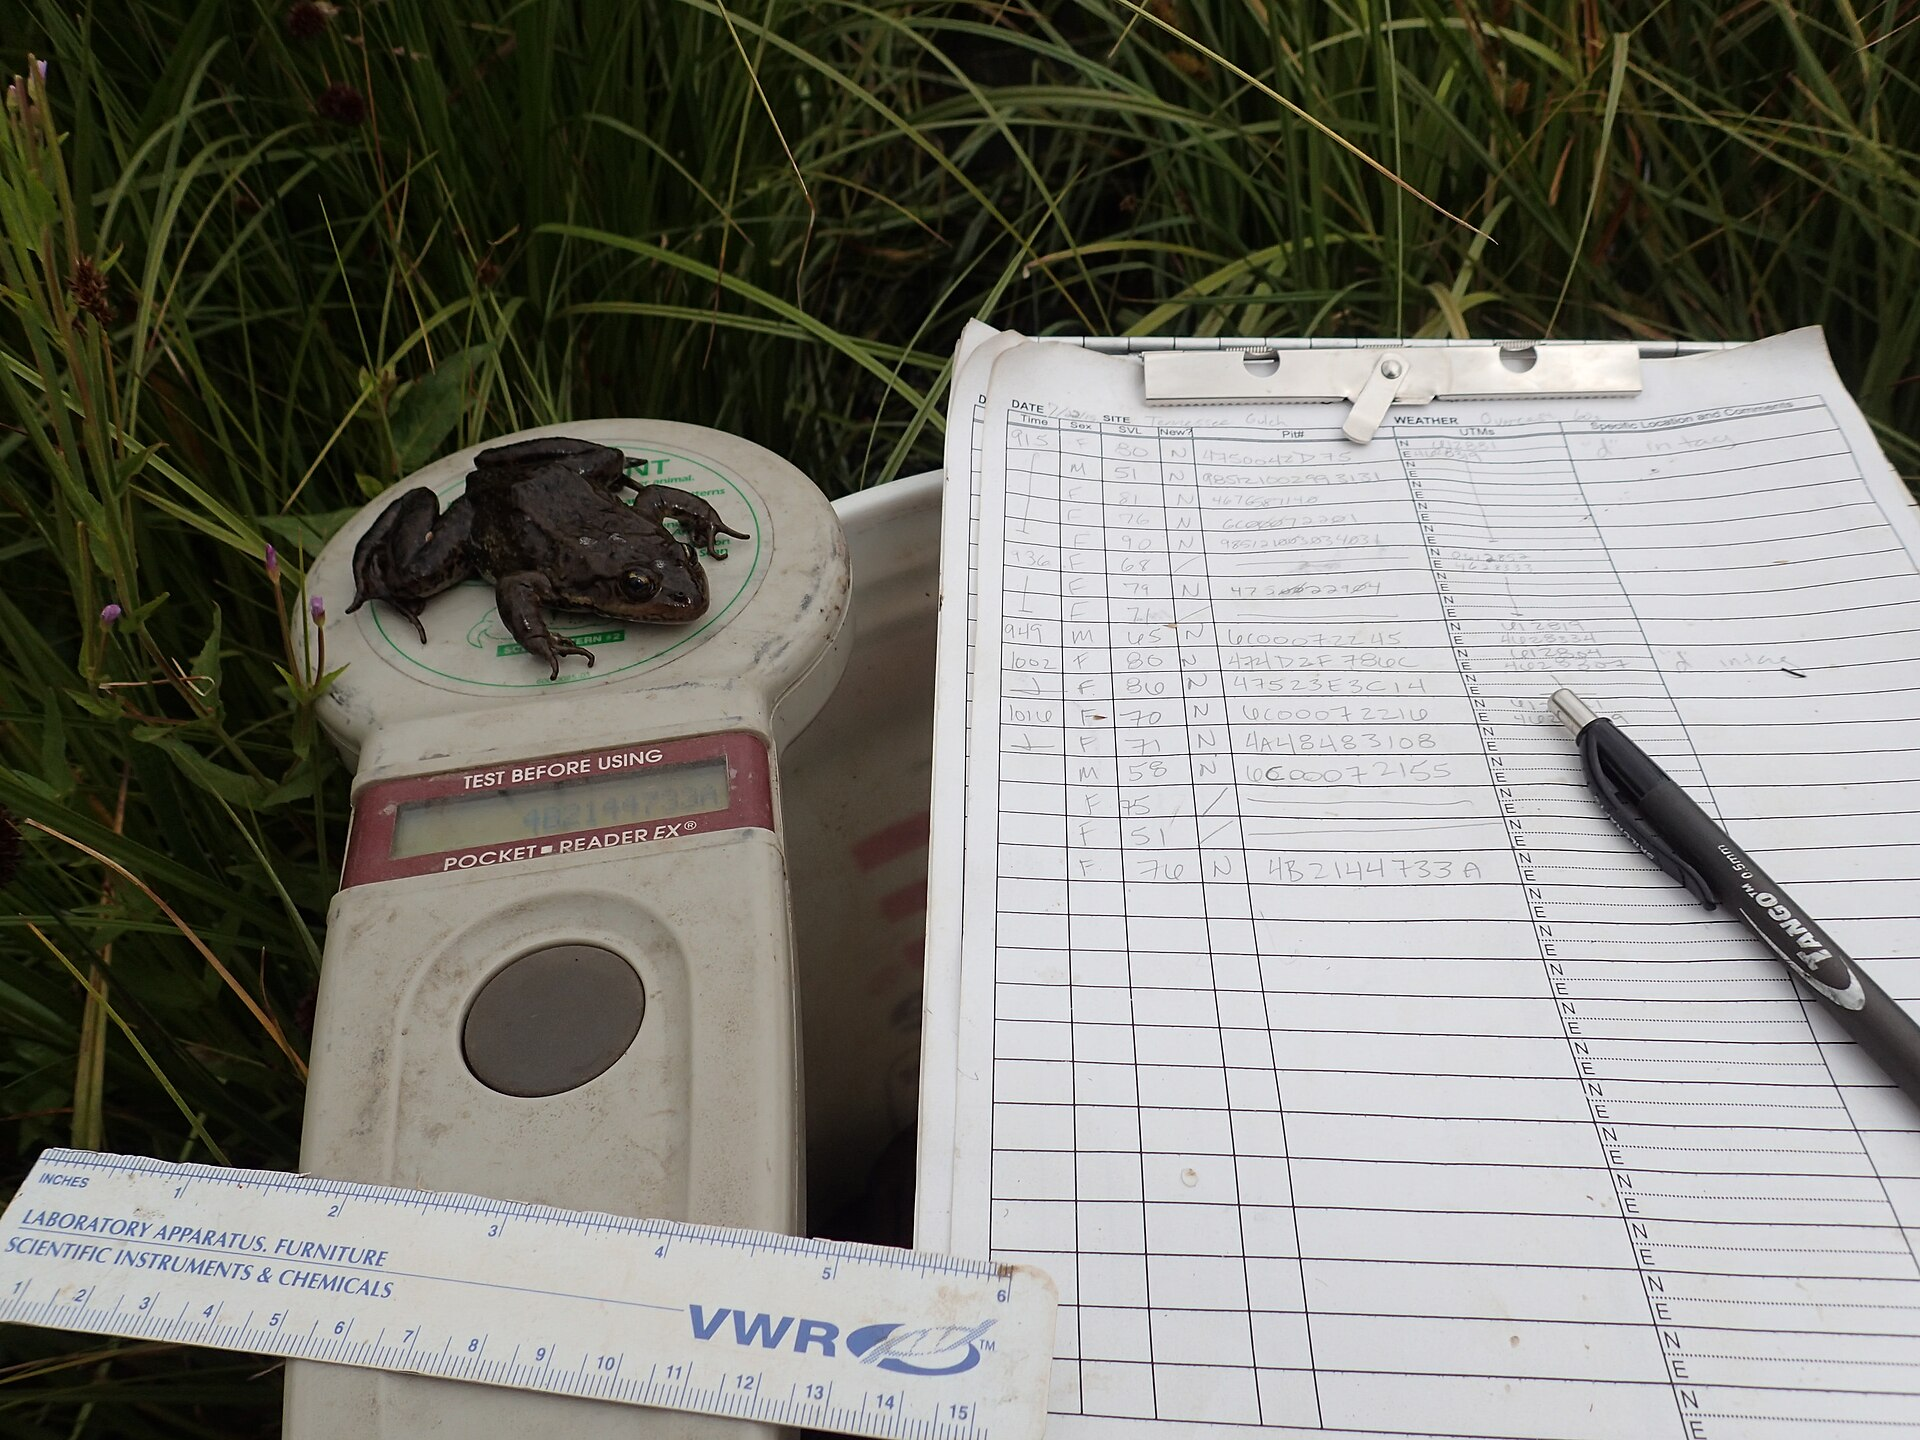
This image shows the practical basis of capture–mark–release–recapture. Organisms are temporarily captured, marked, and later sampled again to estimate total population size. It helps connect the Lincoln index to real ecological fieldwork. Source
Carrying capacity and limiting factors
Carrying capacity = the maximum population size that an environment can support over time.
It is limited by resources such as:
food
water
space/territory
nesting sites
light or mineral ions for plants
As population size rises, competition for limited resources increases.
In exam answers, relate carrying capacity to resource limitation, not just “maximum possible size”.
Density-dependent control and negative feedback
Density-dependent factors become stronger as population density increases.
These factors tend to push population size back toward the carrying capacity by negative feedback.
Examples:
stronger competition for resources
greater predation risk
faster spread of pathogens or pests
Density-independent factors also affect populations, but do not depend on density.
Core exam idea: density-dependent factors help regulate population size.
Population growth curves
Early growth is often exponential because resources are abundant and competition is low.
Exponential growth gives a J-shaped curve.
Sigmoid growth gives an S-shaped curve:
early rapid increase
growth rate slows as limiting factors intensify
population levels off near carrying capacity
IB note: do not assume a lag phase as part of the sigmoid model here.
Population growth curves are models: useful, but simplified.
To test for exponential growth, plot:
logarithmic scale on the y-axis for population size
normal scale on the x-axis for time
exponential growth gives a straight line on this graph
Practical modelling organisms may include yeast or duckweed.
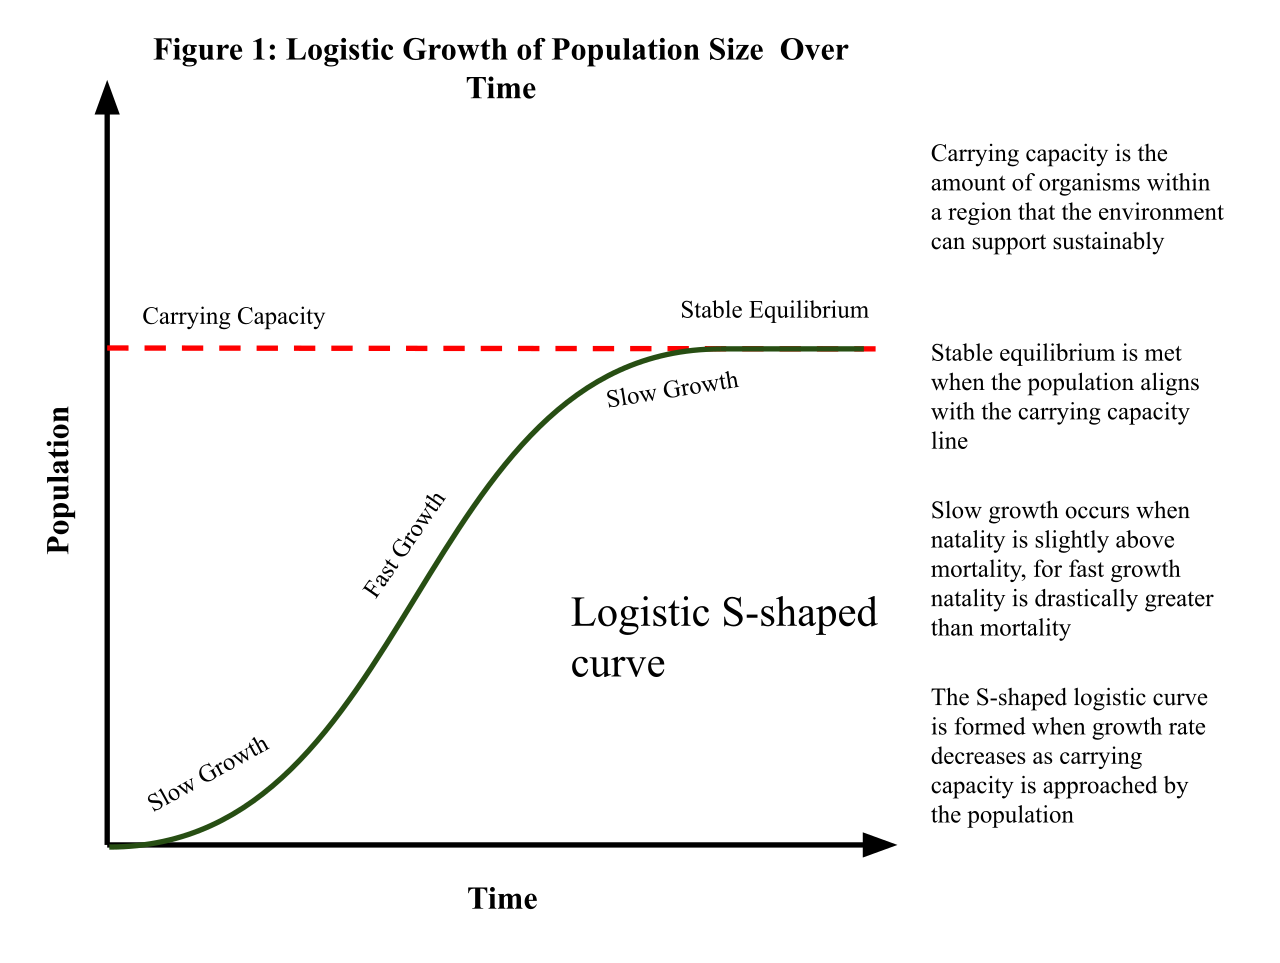
This image shows the classic sigmoid (S-shaped) population growth curve. It illustrates how rapid growth slows as limiting factors increase and the population approaches carrying capacity. This is the key model for regulated population growth in IB Biology. Source
Intraspecific relationships: competition and cooperation
Intraspecific = interactions within the same species.
Competition occurs because members of the same species need similar resources.
Causes of intraspecific competition include:
food
space
light
water
mates
shelter/territory
Cooperation can also occur within a population.
Examples of cooperation may include:
group hunting
parental care
social defence
cooperative breeding
Exam tip: compare competition vs cooperation as two valid intraspecific relationships.
Communities and interspecific relationships
Community = all interacting organisms in an area.
Includes all populations of plants, animals, fungi, and bacteria.
Interspecific relationships = interactions between different species.
Required categories:
herbivory
predation
interspecific competition
mutualism
parasitism
pathogenicity
Know the effect on each species:
mutualism = +/+
predation/herbivory/parasitism/pathogenicity = +/−
competition = −/−
Mutualism you must know
Mutualism = an interspecific relationship in which both species benefit.
Required examples:
Root nodules in Fabaceae (legumes)
bacteria gain carbohydrates and shelter
plant gains usable nitrogen compounds
Mycorrhizae in Orchidaceae (orchids)
fungus gains organic nutrients from plant
plant gains improved water and mineral ion uptake
Zooxanthellae in hard corals
algae gain protection and access to CO₂ / mineral nutrients
coral gains photosynthetic products
In exam responses, always state how each partner benefits.
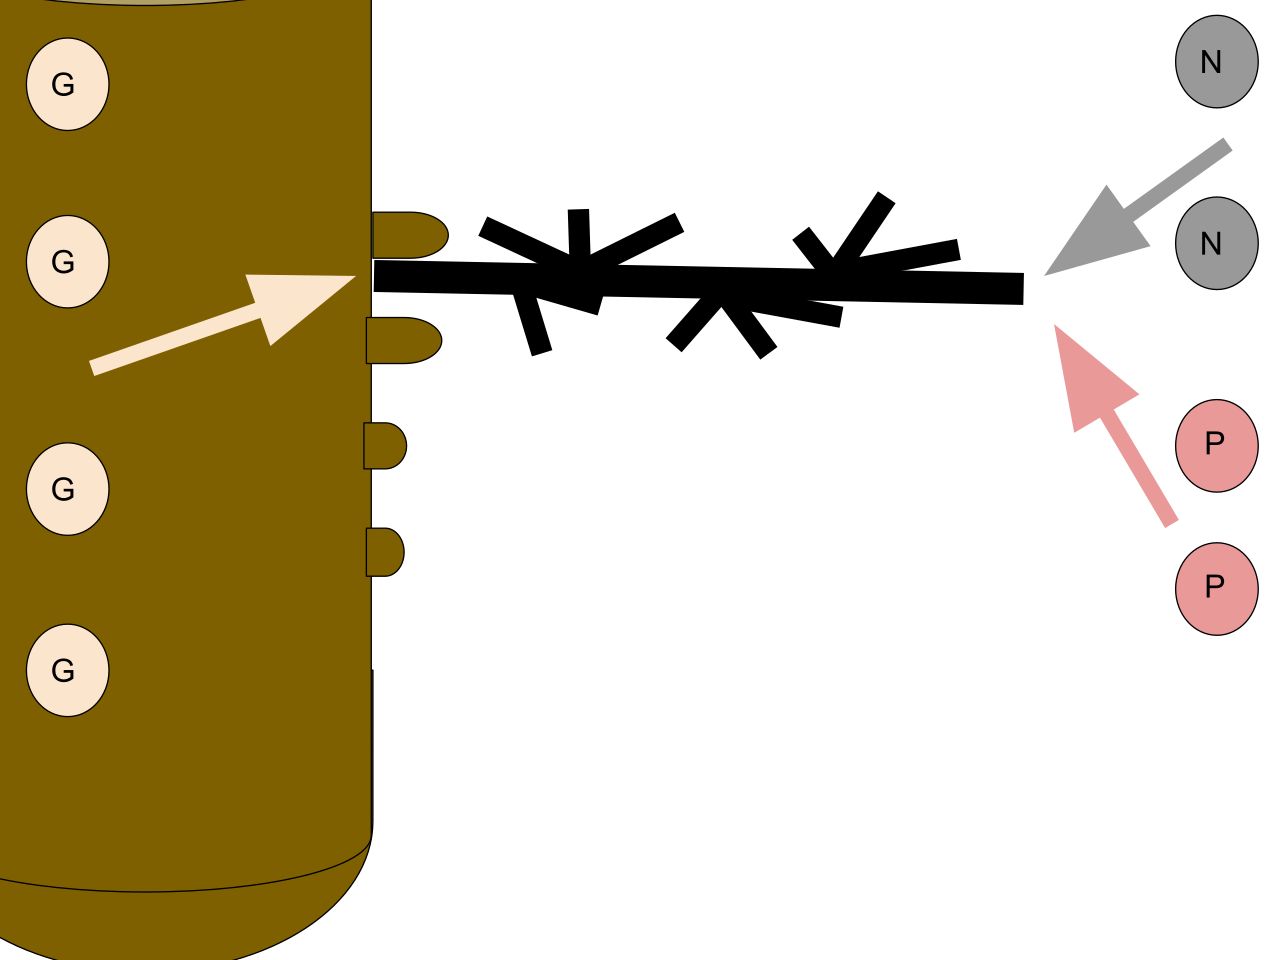
This image shows mutualism between a plant and mycorrhizal fungus. The fungus helps the plant absorb water and mineral ions, while the plant supplies organic compounds from photosynthesis. It is a direct visual match for the required IB example of mycorrhizae. Source
Invasive vs endemic species
Endemic species are native and restricted to a particular area.
Invasive species are introduced species that spread successfully and compete with local species.
A species becomes invasive if it has a competitive advantage in resource acquisition.
This can reduce survival or reproduction of endemic species.
In exams, focus on resource competition rather than just “the invasive species is stronger”.
Testing for interspecific competition
Interspecific competition is indicated, not automatically proven, when one species does better in the absence of another.
Valid approaches:
laboratory experiments
field observations using random sampling
field manipulation by removing one species
Important NOS point:
hypotheses can be tested by both experiments and observations
Be ready to explain why evidence may suggest competition but not prove it completely.
Chi-squared test for association between two species
Used with presence/absence data from multiple sampling sites.
It tests whether the distribution of two species is associated.
A significant result may suggest:
negative association → possible competition
positive association → similar habitat preference or facilitation
It does not prove causation.
Always interpret chi-squared results biologically, not just statistically.
Predator–prey relationships
Predator–prey interactions are a classic example of density-dependent control.
If prey numbers increase, predator numbers may later increase because more food is available.
Rising predator numbers can then reduce prey numbers.
Predator numbers may then fall because prey becomes less available.
This can produce cyclical fluctuations in population size.
In exam questions, remember the predator response usually lags behind the prey response.
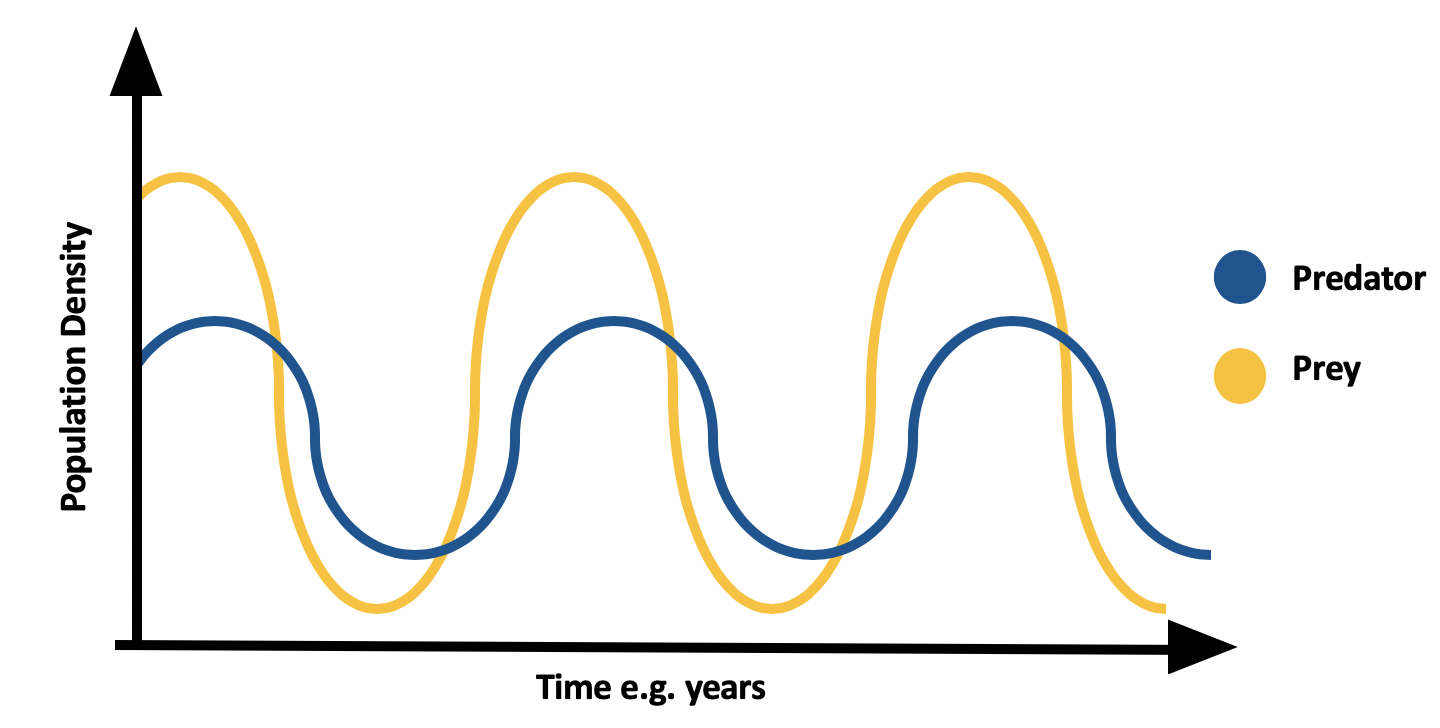
This image shows how prey numbers rise first, followed by a delayed increase in predator numbers. As predation pressure rises, prey decline, followed later by predator decline. It is a clear visual for density-dependent population regulation. Source
Top-down and bottom-up control
Top-down control: populations at lower trophic levels are mainly regulated by consumers/predators.
Bottom-up control: populations at higher trophic levels are mainly regulated by resource supply / productivity.
Both are possible in communities, but one may be dominant.
Exam tip: identify whether control starts from predators above or resources below.
Allelopathy and antibiotics
Both involve release of chemical substances into the environment to deter potential competitors.
Allelopathy:
usually in plants
chemicals reduce germination or growth of nearby competitors
Antibiotics:
produced by microorganisms
inhibit or kill competing microorganisms
Similarity: both reduce competition using chemical interference.
Difference: allelopathy is commonly plant-to-plant; antibiotics usually act against microbes.
Checklist: can you do this?
Estimate population size using quadrat data and the Lincoln index.
State and apply the assumptions of capture–mark–release–recapture.
Interpret exponential and sigmoid growth curves, including carrying capacity and density-dependent control.
Classify interspecific interactions and explain the effect on each species.
Interpret chi-squared association data for two species without claiming it proves causation.
Exam traps and high-yield reminders
Population = one species; community = all interacting species.
Random sampling reduces bias, but does not eliminate sampling error.
Quadrats are for sessile organisms; mark–recapture is for motile organisms.
Carrying capacity is not fixed forever; it depends on available resources and conditions.
Density-dependent factors regulate population size by negative feedback.
Significant association in chi-squared data suggests a relationship, but does not prove competition.
There is no additional HL content in C4.1.