Core ideas and scale
Biosphere = the part of Earth where life exists; it contains individuals, populations, communities and ecosystems.
Individual organism = one member of a species.
Species = organisms that can interbreed and produce fertile offspring.
Population = organisms of the same species living in the same area at the same time and able to interbreed.
Community = all the interacting populations in an area.
Ecosystem = the community + physical environment and the interactions between them.
Exam tip: be able to move clearly between the levels individual → population → community → ecosystem → biosphere.
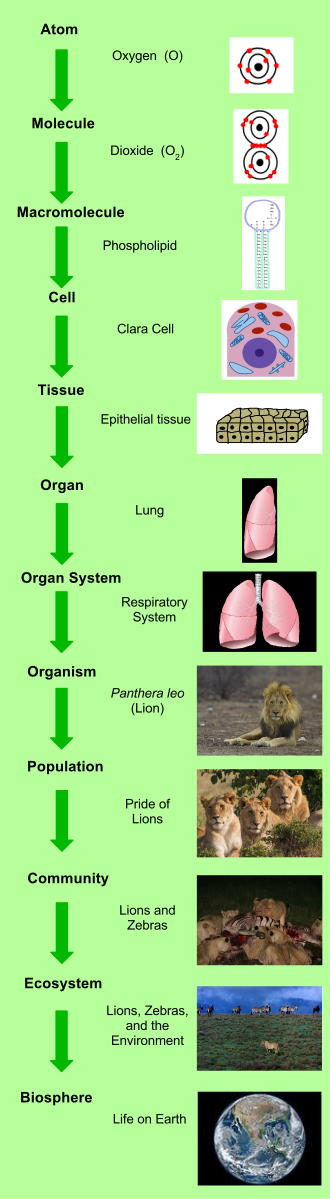
This diagram shows the ecological levels of organization in order. It is useful for distinguishing between an individual, a population, a community and an ecosystem. Use it to avoid mixing up the scale of each term in exam definitions. Source
Classification and identification
Classification helps scientists identify organisms efficiently and predict characteristics.
Binomial nomenclature: first name = genus; second name = species.
Write Genus species with genus capitalized, species lower case, and both italicized if possible.
Species in the same genus share more similar characteristics than species in different genera.
Taxonomists identify organisms using dichotomous keys, reference collections, and DNA surveys.
Practical skill: know how to use a dichotomous key, and why it is most useful when each step gives two contrasting choices.
Populations and distribution
The distribution of a population depends on both abiotic and biotic factors.
Abiotic factors = non-living physical factors, such as temperature, sunlight, pH, salinity, dissolved oxygen, soil texture.
Biotic factors = living influences, such as competition, predation, disease, food availability.
In ESS questions, link a species’ distribution to measurable environmental variables.
Strong exam answers use the pattern: factor changes → survival/reproduction changes → distribution changes.
Niche and habitat
Habitat = the place where an organism, population or community lives.
Niche = the role of a species and the set of biotic and abiotic conditions/resources it depends on.
A niche includes factors such as food source, temperature range, space, predators, competition, and reproductive requirements.
Exam tip: habitat = address; niche = job/role is a helpful distinction.
For named-species questions, include both where it lives and how it survives there.
Species interactions
Populations interact through herbivory, predation, parasitism, mutualism, disease, and competition.
These interactions affect population dynamics and create selective pressures.
Predation/herbivory can reduce prey or plant numbers and influence adaptation.
Parasitism benefits one organism while harming the host.
Mutualism benefits both species.
Competition occurs when organisms use the same limited resources.
Exam tip: always state the effect on both populations where possible.
Carrying capacity and population growth
Carrying capacity = the maximum population size that can be supported by available resources.
Limiting resources may be food, water, light, space, oxygen, nesting sites, or other biotic/abiotic factors.
Density-dependent factors regulate populations more strongly as population density rises.
Examples: competition, predation, pathogen transfer, parasitism.
These act through negative feedback, pushing population size back toward equilibrium.
Density-independent factors such as extreme weather can affect population size, but usually do not regulate it around carrying capacity.
Exponential growth gives a J-curve when limiting factors are absent.
Logistic growth gives an S-curve when limiting factors increase as population size rises.
Be able to interpret boom-and-bust patterns as overshoot followed by crash.
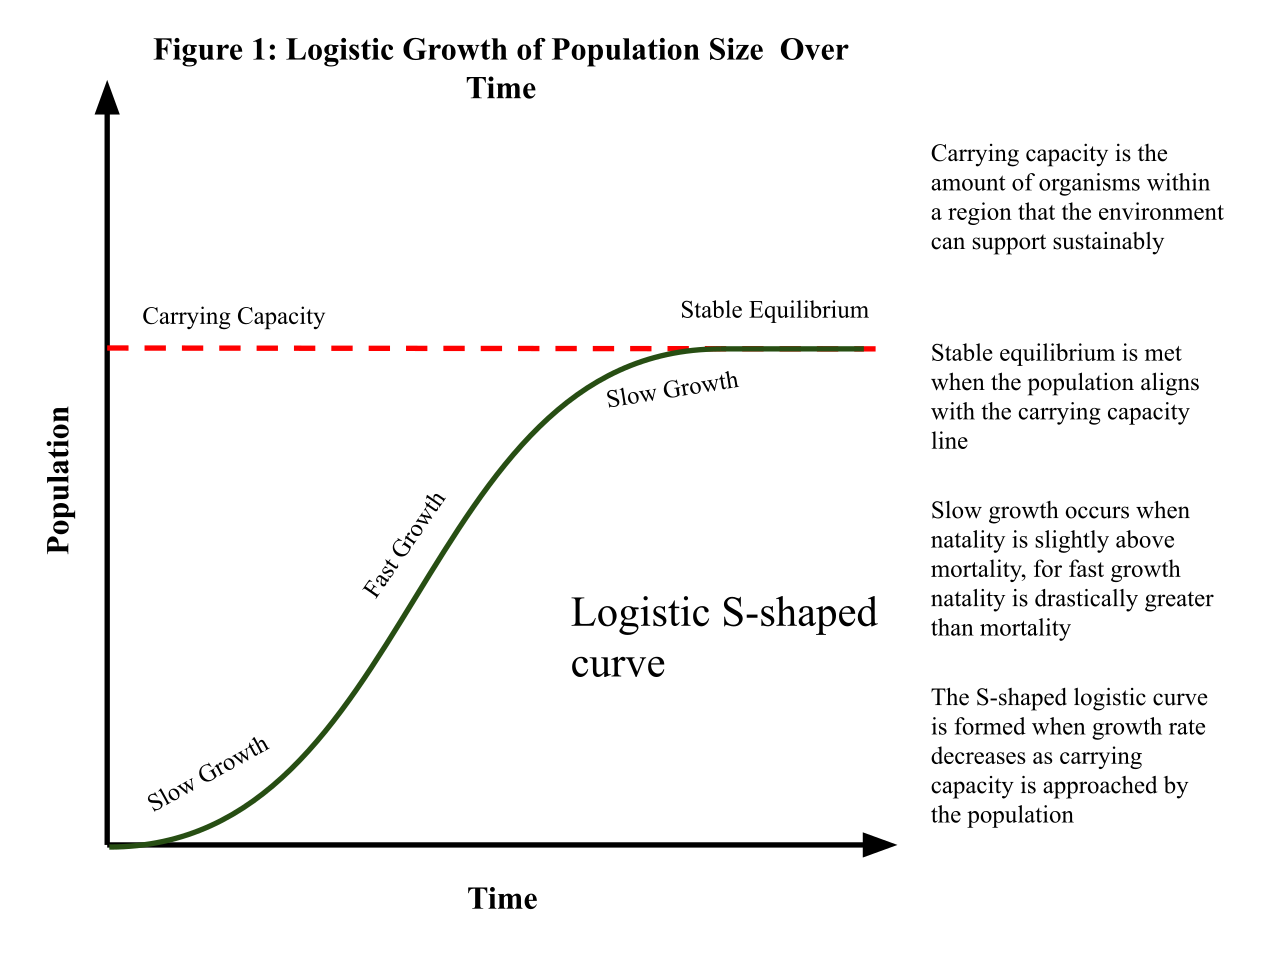
This graph shows logistic growth, where population size rises quickly and then levels off near carrying capacity. It is ideal for ESS questions on negative feedback and regulation around equilibrium. Use it to contrast with exponential growth. Source
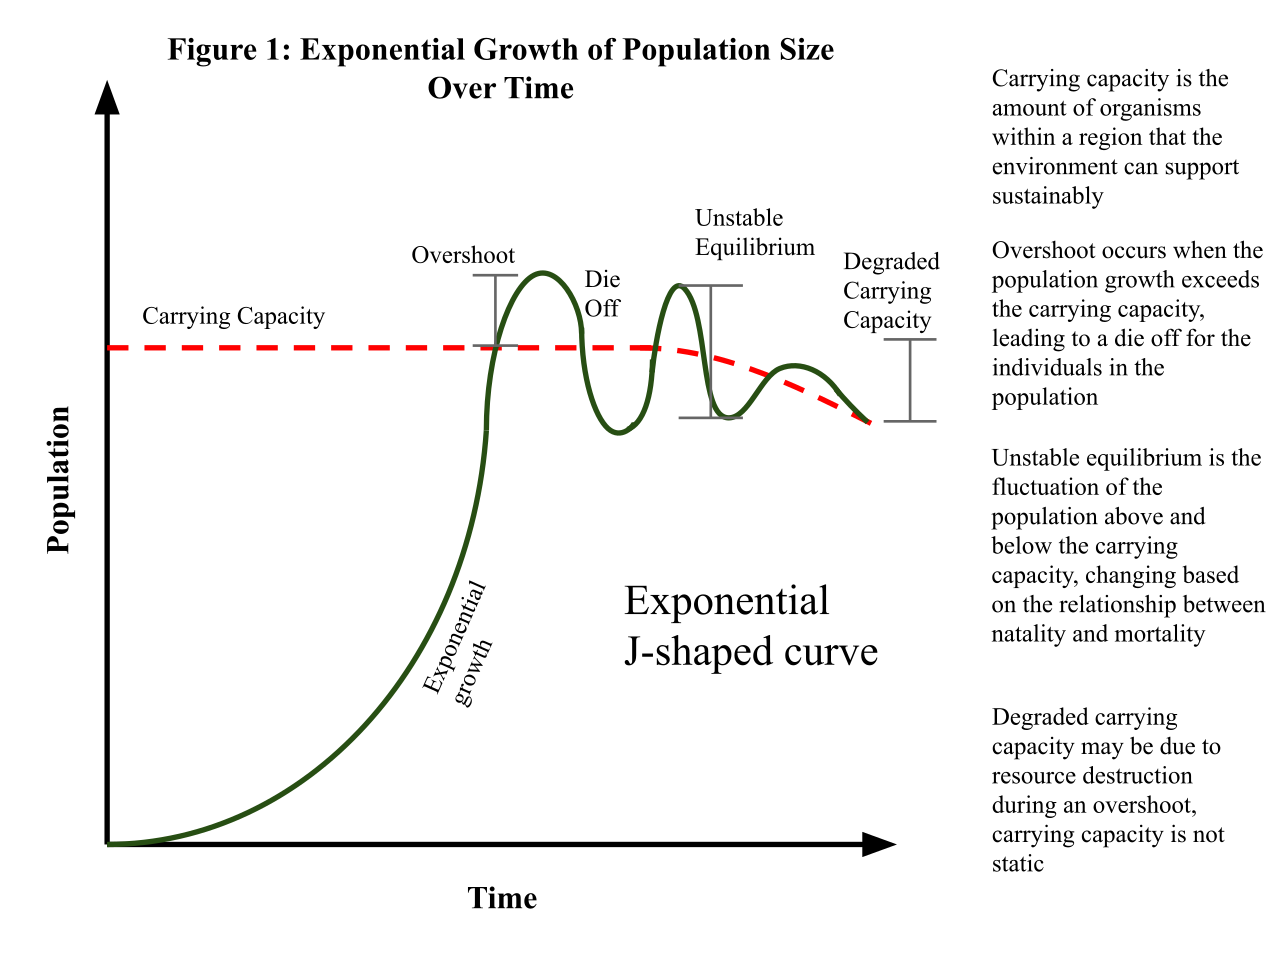
This graph shows a boom-and-bust pattern caused by rapid growth beyond carrying capacity. It helps explain overshoot, resource depletion and unstable equilibrium. Use it when a question asks about crash dynamics rather than stable regulation. Source
Human populations and carrying capacity
Human population growth has been increased by reducing many natural limiting factors.
Key reasons include technological advances, improved food production, medical care, sanitation, and removal of predators.
Human impacts can also degrade ecosystems, reducing long-term sustainability.
Human carrying capacity is difficult to assess because the human niche is broad, mobile and constantly changing.
Humans can import resources, change technology, alter consumption patterns, and transform environments.
Exam tip: for humans, carrying capacity is dynamic and disputed, not a fixed value.
Estimating population abundance
Population abundance can be estimated by random sampling, systematic sampling, or transect sampling.
Choose method based on the organism and distribution pattern.
Random sampling reduces bias.
Systematic sampling is useful for regular coverage.
Transects are best for studying change along an environmental gradient.
For non-mobile organisms, use quadrats.
Percentage cover = proportion of area covered by the species.
Percentage frequency = percentage of sample units in which the species occurs.
These estimate abundance, but not always exact population size.
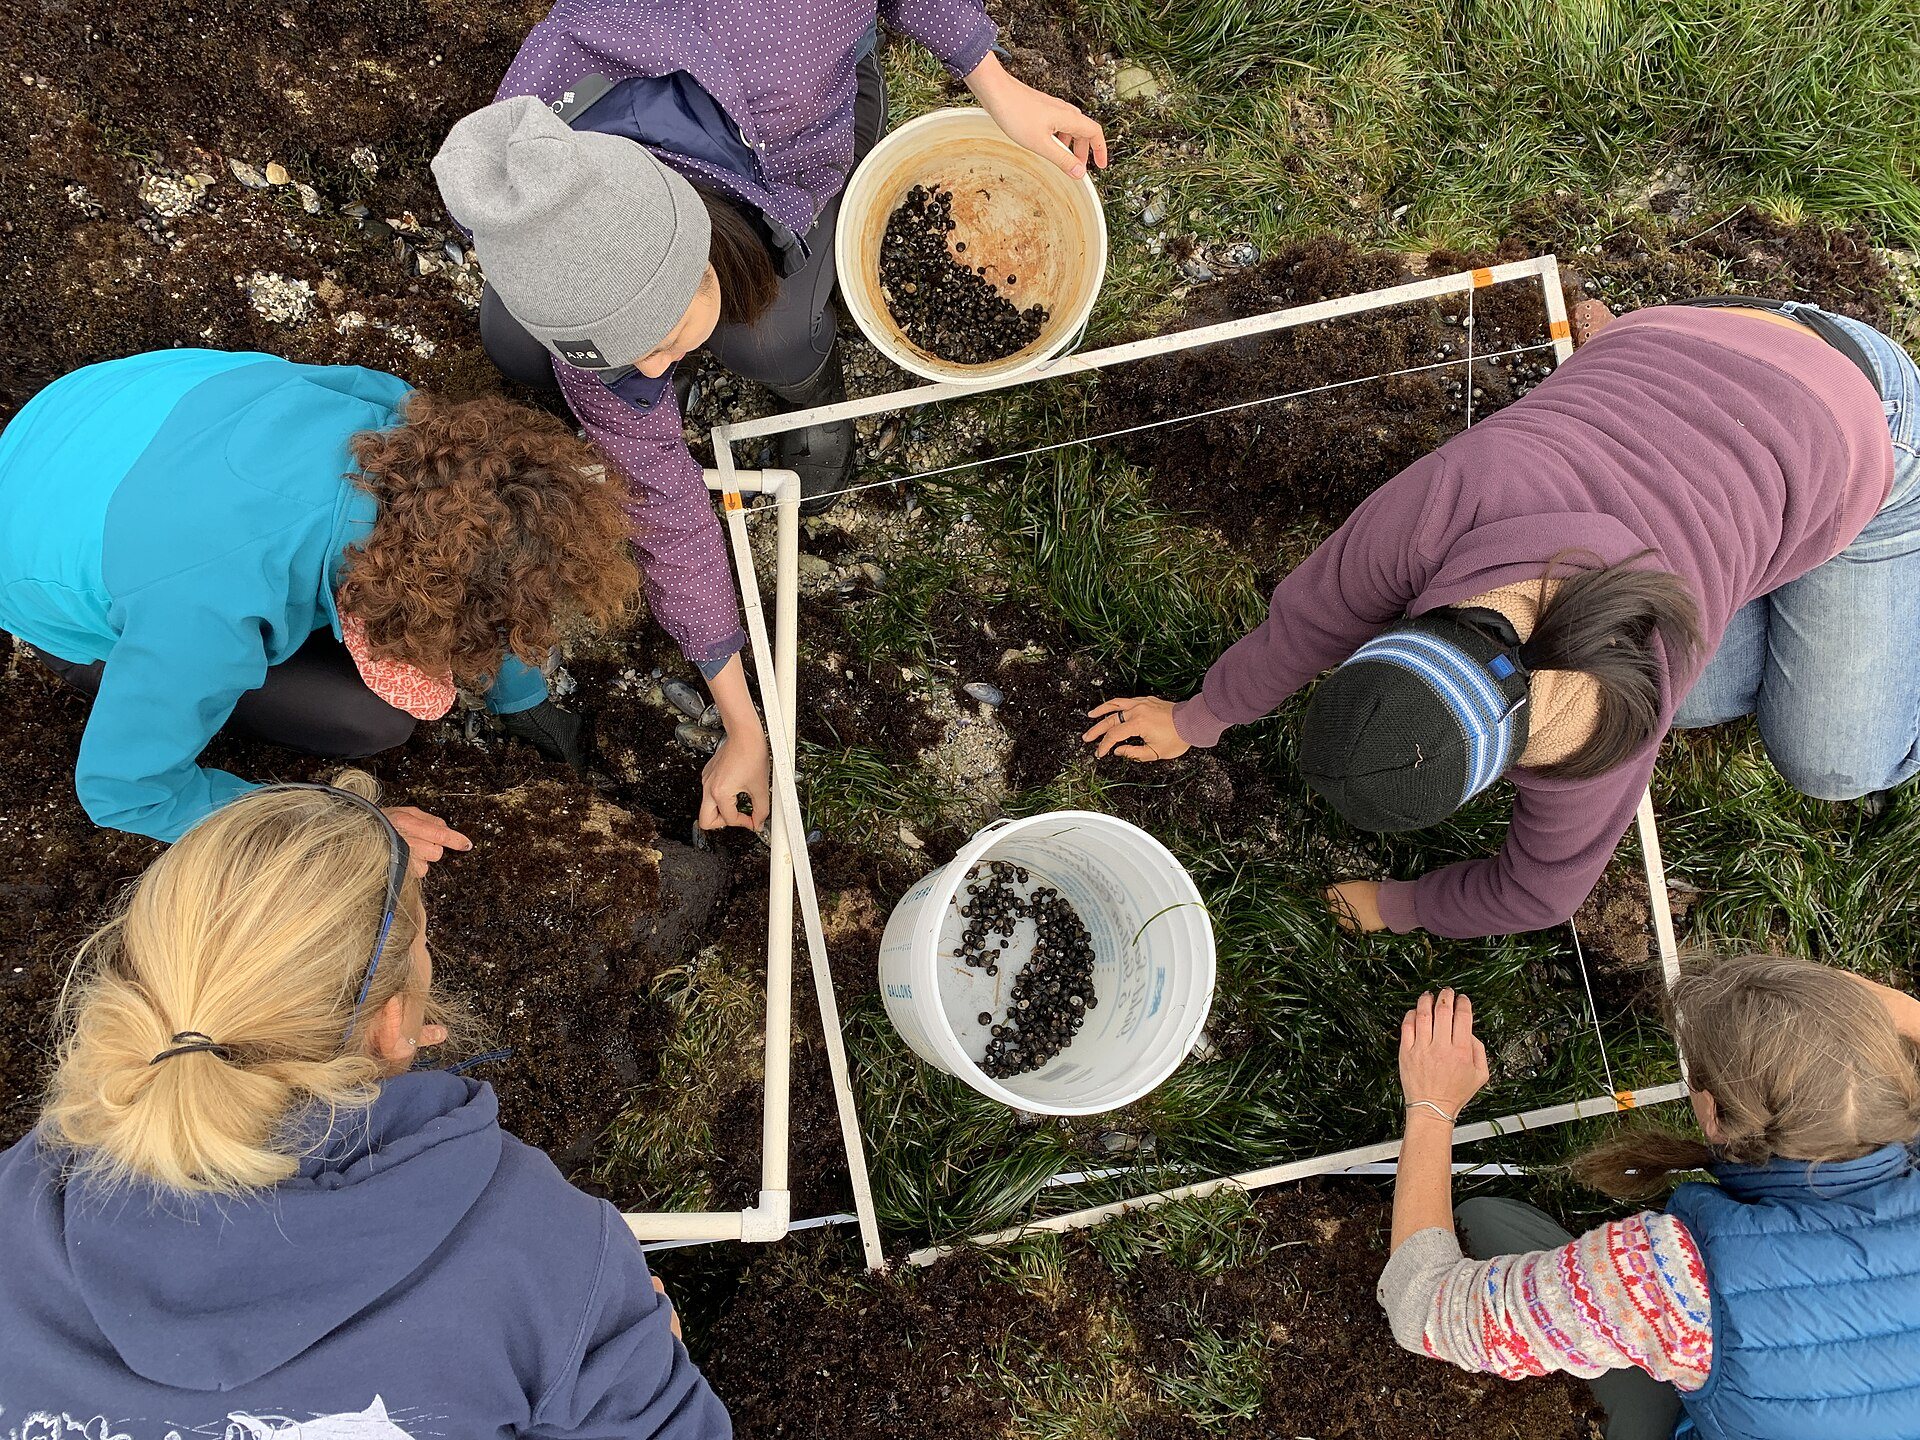
This image shows how transects and quadrats are used to sample non-mobile organisms across an environmental gradient. It is especially useful for linking method choice to zonation and distribution. Use it to remember that quadrats suit sessile species, not fast-moving ones. Source
Capture–mark–release–recapture
For mobile organisms, population size can be estimated by capture–mark–release–recapture.
The Lincoln index is:
M = number initially captured and marked.
N = total number captured in the second sample.
R = number of marked individuals recaptured.
If R is small, estimated population size becomes large.
Main assumptions:
the population is closed during sampling
marked individuals have mixed fully back into the population
marks are not lost
marking does not affect survival or recapture chance
each individual has an equal chance of capture
Exam tip: after calculating the estimate, always comment on limitations and assumptions.
Ecosystems and stability
Ecosystems are open systems: both energy and matter can enter and leave.
A natural ecosystem can show steady-state balance, where inputs and outputs are balanced over time.
This is why sustainability is a natural property of ecosystems.
Long-lasting ecosystems, such as tropical rainforests, show that ecosystems can persist for very long periods if major disturbances are limited.
Human activities can push ecosystems toward tipping points.
A tipping point is reached when change becomes large enough to shift the system into a new equilibrium.
ESS example: deforestation in the Amazon can reduce transpiration, lower regional rainfall, and undermine forest persistence.
Keystone species and biosphere integrity
A keystone species has a disproportionately large effect on community structure relative to its abundance.
Removing a keystone species can trigger major ecosystem change or collapse.
ESS examples:
Purple sea stars control mussel populations on rocky shores.
Elephants maintain savannah grasslands by preventing woody vegetation from dominating.
The planetary boundaries model indicates that biosphere integrity has passed a critical threshold.
High extinction rates and ecosystem disturbance show that human activity is reducing species diversity and destabilizing ecosystems.
To avoid critical tipping points, loss of biosphere integrity must be reversed through ecosystem protection and restoration.
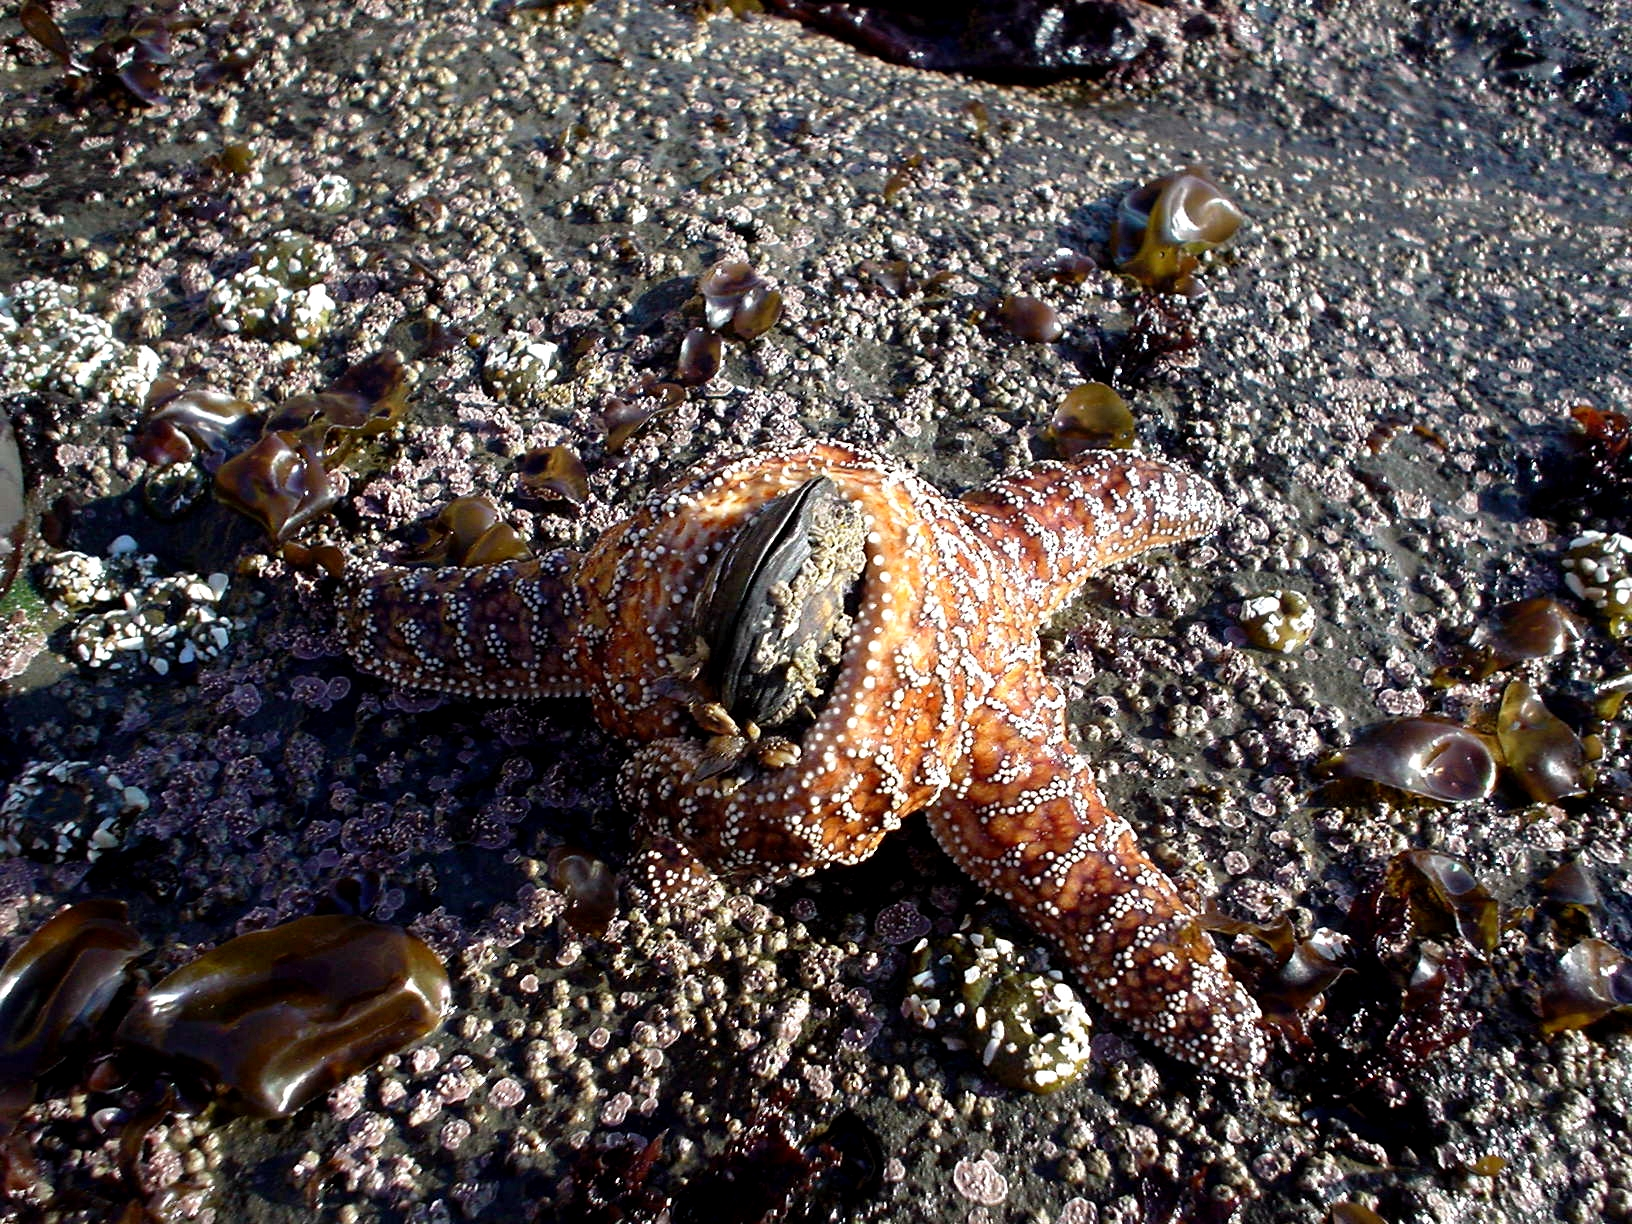
This image illustrates a keystone-species idea in a simple food interaction: a predator can stop one species from dominating the community. In ESS, sea stars are used as an example of how removing a keystone predator can destabilize an ecosystem. Link this to community structure and collapse risk. Source
Checklist: can you do this?
Define clearly: species, population, community, habitat, niche, ecosystem, carrying capacity.
Interpret J-curves, S-curves, and boom-and-bust population graphs.
Explain how density-dependent factors regulate populations using negative feedback.
Choose and justify an appropriate sampling method: quadrat, transect, random/systematic sampling, or mark–release–recapture.
Use and evaluate the Lincoln index, including its assumptions.
HL only: classification, niche and life-history detail
A clade groups organisms that evolved from a common ancestor; it better shows evolutionary relationships.
Traditional hierarchy (kingdom, phylum, class, order, family, genus, species) does not always match actual patterns of divergence.
Fundamental niche = the full range of conditions/resources a species could use without limiting factors.
Realized niche = the niche actually occupied after competition and other limiting factors act.
Named examples often used: Connell’s barnacles or brown and green anoles.
r-strategists produce many offspring, colonize rapidly, and suit unstable or newly disturbed habitats.
K-strategists produce few offspring, invest more in each, and suit stable communities.
Knowing classification, niche requirements and life cycles helps explain human impacts on species.
Climate change can disrupt seasonal timing, causing mismatches between the life cycles of plants and animals.
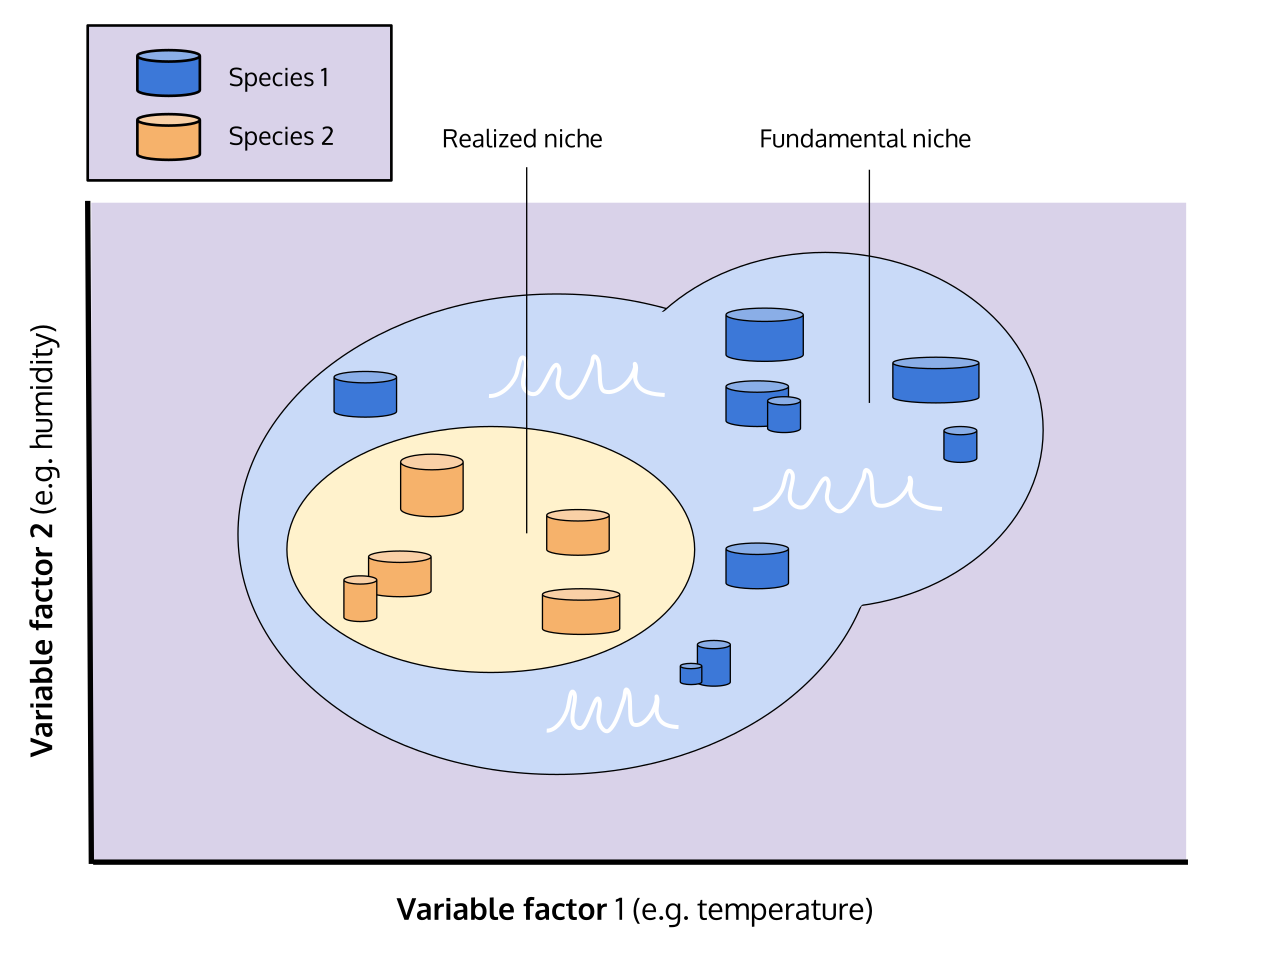
This diagram shows that a realized niche is usually narrower than a fundamental niche because real organisms face competition and environmental constraints. It is especially useful for HL-only niche questions. Use it to explain why a species may survive in fewer conditions than it could theoretically tolerate. Source
Fast exam links and common traps
Do not confuse habitat with niche.
Do not say all growth is exponential; most real populations are limited by resources.
Do not forget that density-dependent factors are the main regulators around carrying capacity.
Do not use quadrats for highly mobile organisms.
Do not use the Lincoln index without discussing assumptions.
When asked about ecosystem collapse, link human disturbance → tipping point → new equilibrium.
When asked about conservation importance, mention keystone species, biosphere integrity, and prevention of tipping points.