Core idea
Ecosystems are open systems sustained by continuous supplies of energy and matter.
Energy flows through ecosystems and is eventually lost as heat; matter cycles and is transferred between organisms.
Energy transformations obey the first law of thermodynamics: energy cannot be created or destroyed, only changed from one form to another.
The second law of thermodynamics explains why energy transfers are inefficient: some energy is always degraded to a less useful form, mainly heat.
Big exam idea: energy flow is one-way, but matter is recycled.
Photosynthesis, respiration and biomass
Photosynthesis converts light energy into chemical energy stored in glucose.
Some glucose is converted into other carbon compounds and stored as biomass.
Autotrophs make organic compounds from inorganic carbon and other elements.
Producers are the first trophic level and are usually plants, algae and photosynthetic bacteria.
Cellular respiration releases energy from glucose for cell activities.
During respiration, some chemical energy is transformed into heat, so energy is lost from the ecosystem.
Know the contrast:
Photosynthesis = stores energy in organic molecules.
Cellular respiration = releases energy from organic molecules.
Biomass = the mass of organic matter in organisms or a trophic level, often measured as dry mass.
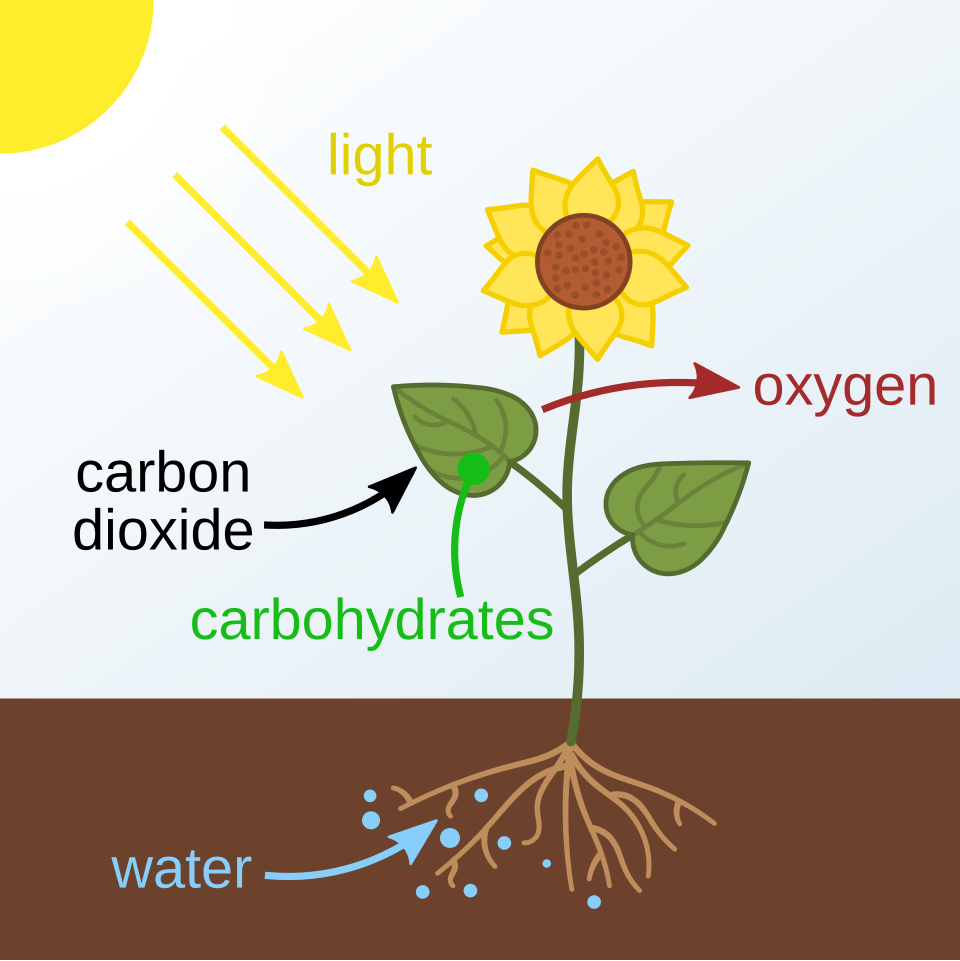
This diagram summarizes photosynthesis as the entry point of energy into ecosystems. It shows sunlight, carbon dioxide and water being converted into oxygen and carbohydrates, helping students connect producer biomass to energy storage. Source
Trophic levels, food chains and food webs
Consumers obtain chemical energy from organic carbon compounds in other organisms.
Types of consumers you should recognize: herbivores, detritivores, predators, parasites, saprotrophs, scavengers and decomposers.
In a food chain, energy and organic matter flow from producer → primary consumer → secondary consumer → higher consumers.
The stages in a food chain are called trophic levels.
Arrows in food chains and food webs show the direction of energy flow and transfer of biomass.
Food webs are more realistic than food chains because species may feed at more than one trophic level.
Decomposers are often left out of simple food chains, but they are important in food webs because they process dead organic matter and waste.
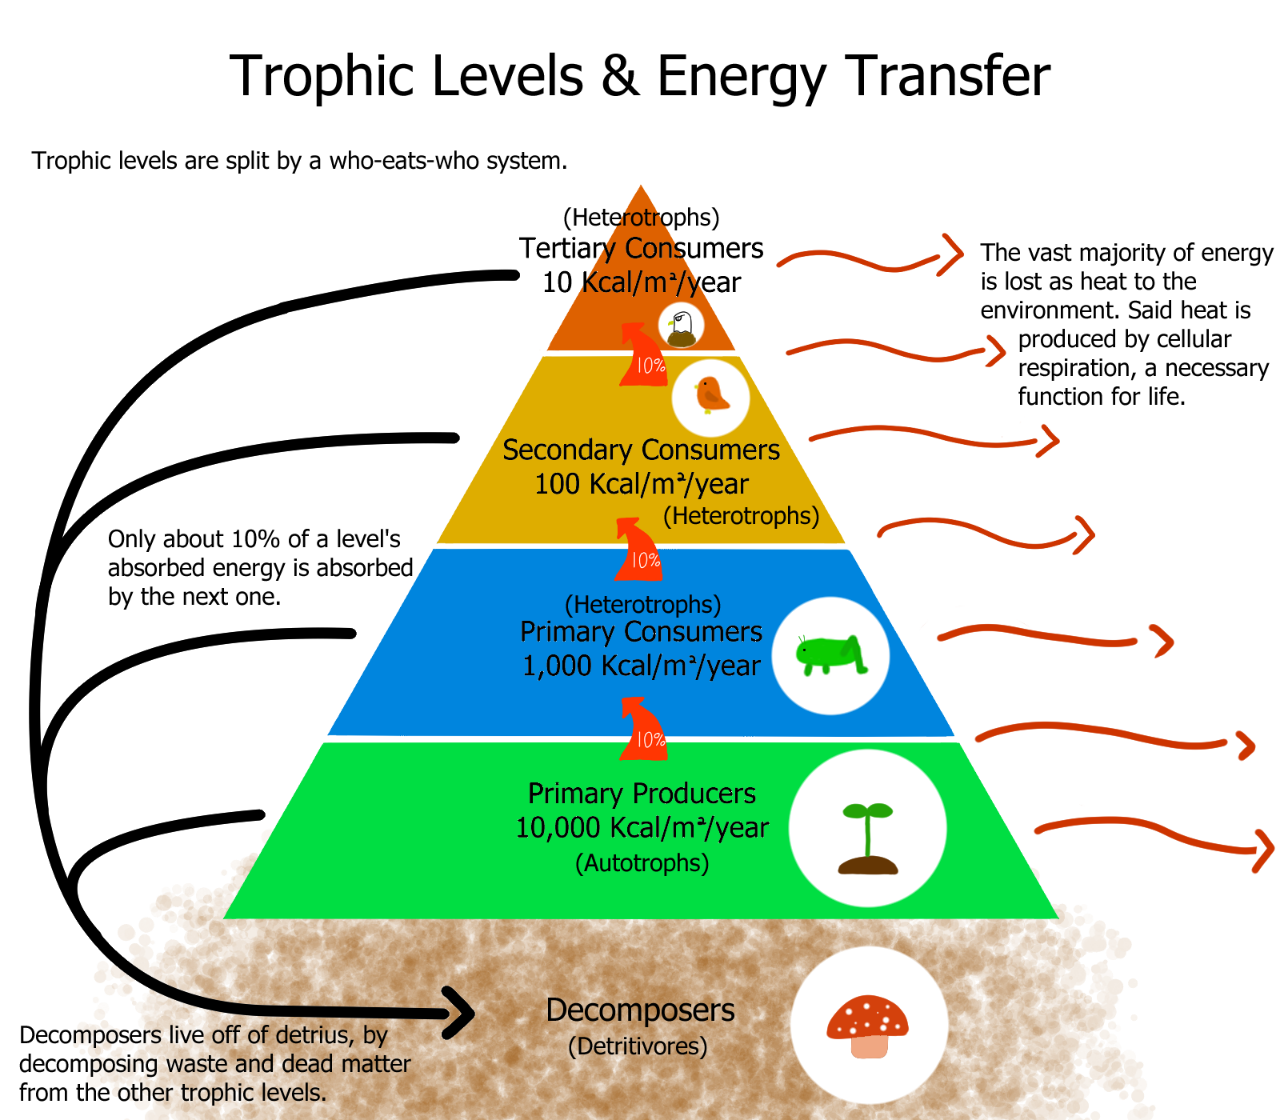
This image shows trophic layers in a pyramid shape and highlights how energy is transferred upward while much is lost at each level. It is useful for revising producer-to-consumer flow, heat loss, and why upper trophic levels contain less available energy. Source
Energy losses along food chains
There is never 100% transfer of energy or organic matter from one trophic level to the next.
Reasons for loss:
not all biomass is harvested
not all harvested biomass is consumed
not all consumed material is absorbed
not all absorbed material is stored as biomass
much energy is lost as heat through respiration
Because of these losses, the number of trophic levels is limited.
Typically 10% or less of energy at one trophic level is available to the next, but this is not fixed and not a true average.
Avoid this mistake: higher trophic levels do not survive simply by “eating more”; the issue is reduced available energy, not effort.
Productivity and efficiency
Gross productivity (GP) = total gain in biomass by an organism or trophic level.
Net productivity (NP) = biomass remaining after losses due to cellular respiration.
Key relationship:
Consumers usually have lower NP than producers because they lose more energy in movement and other activities.
The NP of an organism or trophic level is the maximum sustainable yield that can be harvested without reducing future availability.
Ecological efficiency = percentage of energy transferred from one trophic level to the next.
Efficiency varies by ecosystem, species and trophic level.
Exam link: lower efficiency at each stage explains why food chains are short and why top predators are few.
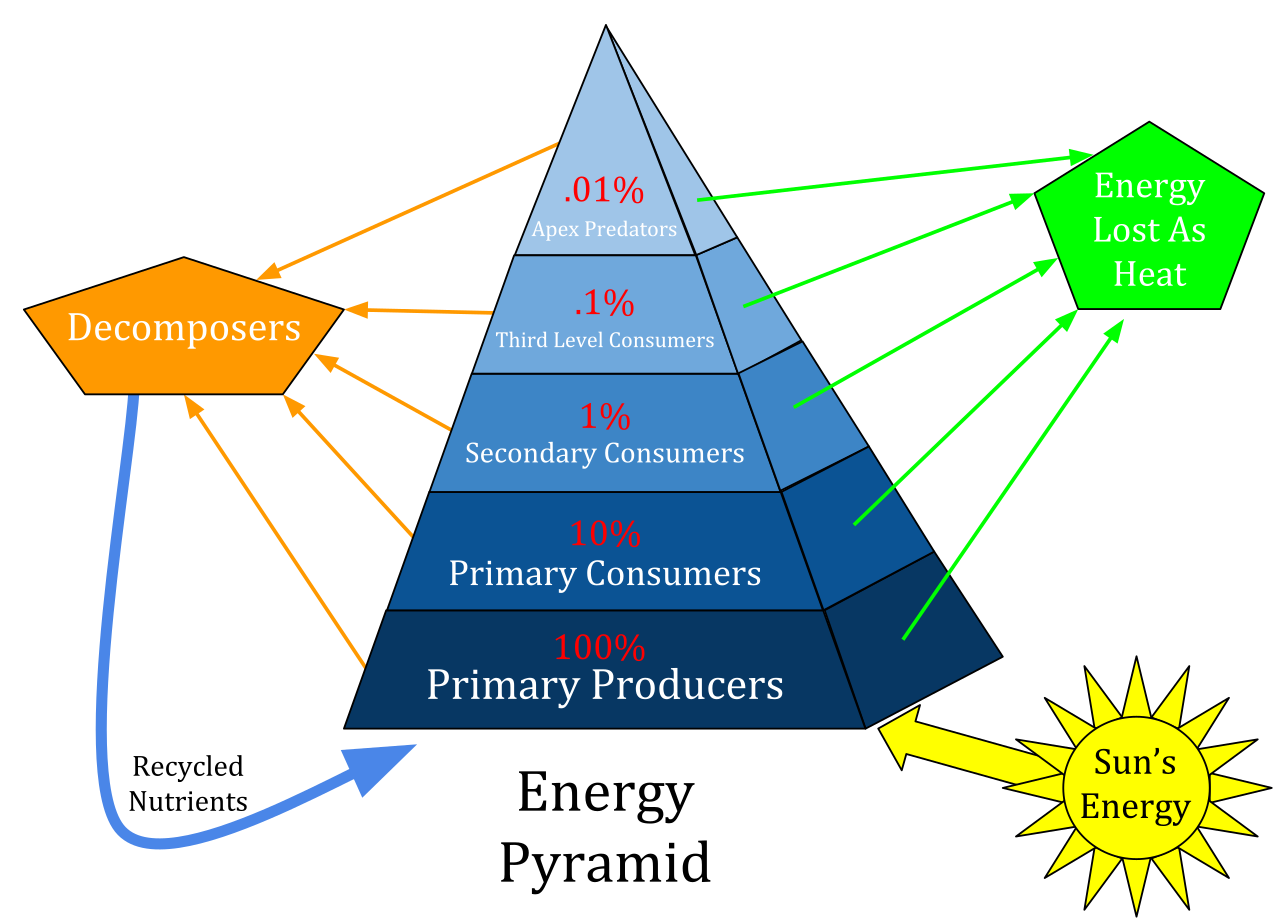
This energy pyramid shows that only a small fraction of energy passes to the next trophic level. It is especially helpful for understanding ecological efficiency, limited trophic levels, and why producers must support the biomass above them. Source
Biomass and ecological pyramids
Biomass of a trophic level can be estimated by collecting and drying samples.
Dry mass is used because water is not part of the organism’s organic biomass.
Energy in biomass can be estimated by combustion and extrapolation.
Ecological pyramids show relative numbers, biomass or energy at different trophic levels.
Pyramids of numbers and pyramids of biomass show the standing crop at a given time.
Pyramids of energy show the amount of energy flowing to each trophic level per unit area per unit time.
Most reliable for exam interpretation:
Energy pyramids are always upright.
Biomass pyramids may vary in shape.
Read axes and units carefully before interpreting.
Pollution in food chains
Non-biodegradable pollutants such as PCB, DDT and mercury can move through food chains.
Bioaccumulation = increasing concentration of a pollutant in an organism or trophic level over time.
Biomagnification = increasing concentration of a pollutant along a food chain, with highest concentrations usually in top consumers.
This happens because biomass is lost between trophic levels, but many pollutants are retained.
Microplastics can absorb non-biodegradable pollutants and increase their transfer through food chains.
Exam tip: bioaccumulation is within organisms over time; biomagnification is up the trophic levels.
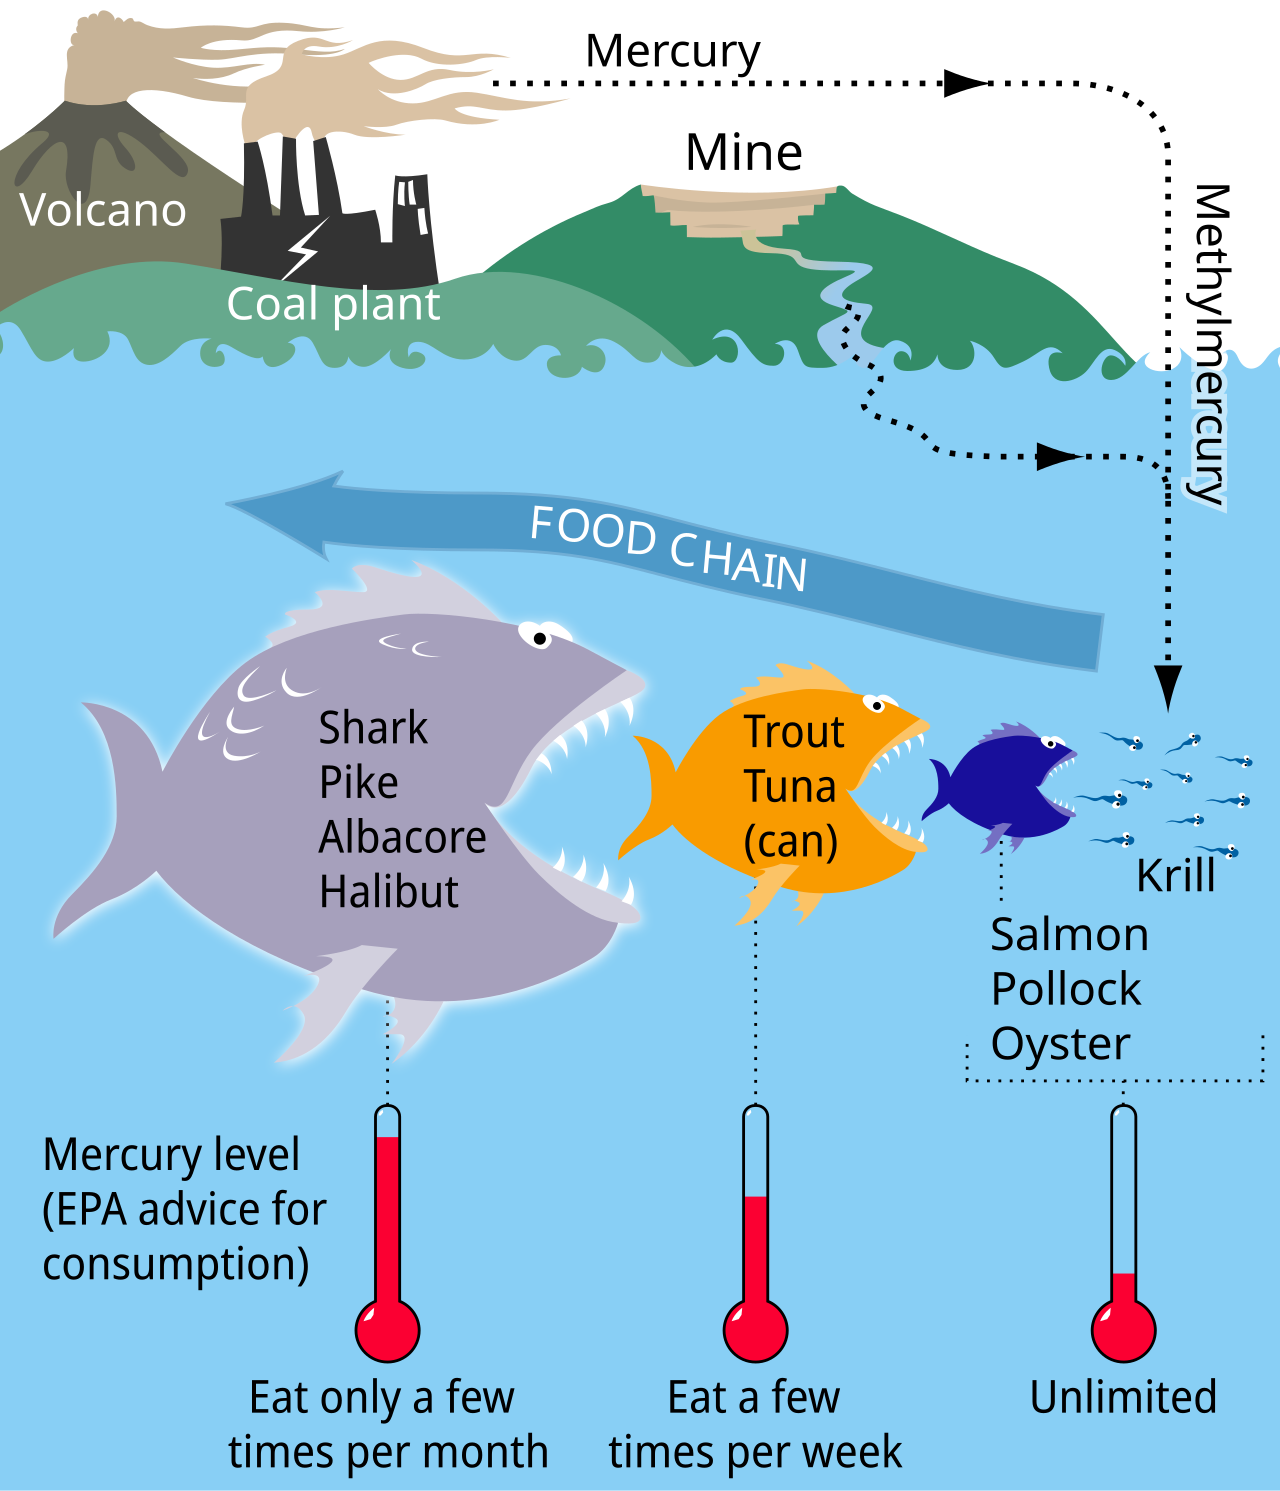
This diagram shows how mercury enters ecosystems, is converted to methylmercury, and becomes more concentrated at higher trophic levels. It is ideal for revising biomagnification and why apex consumers are most at risk from non-biodegradable pollutants. Source
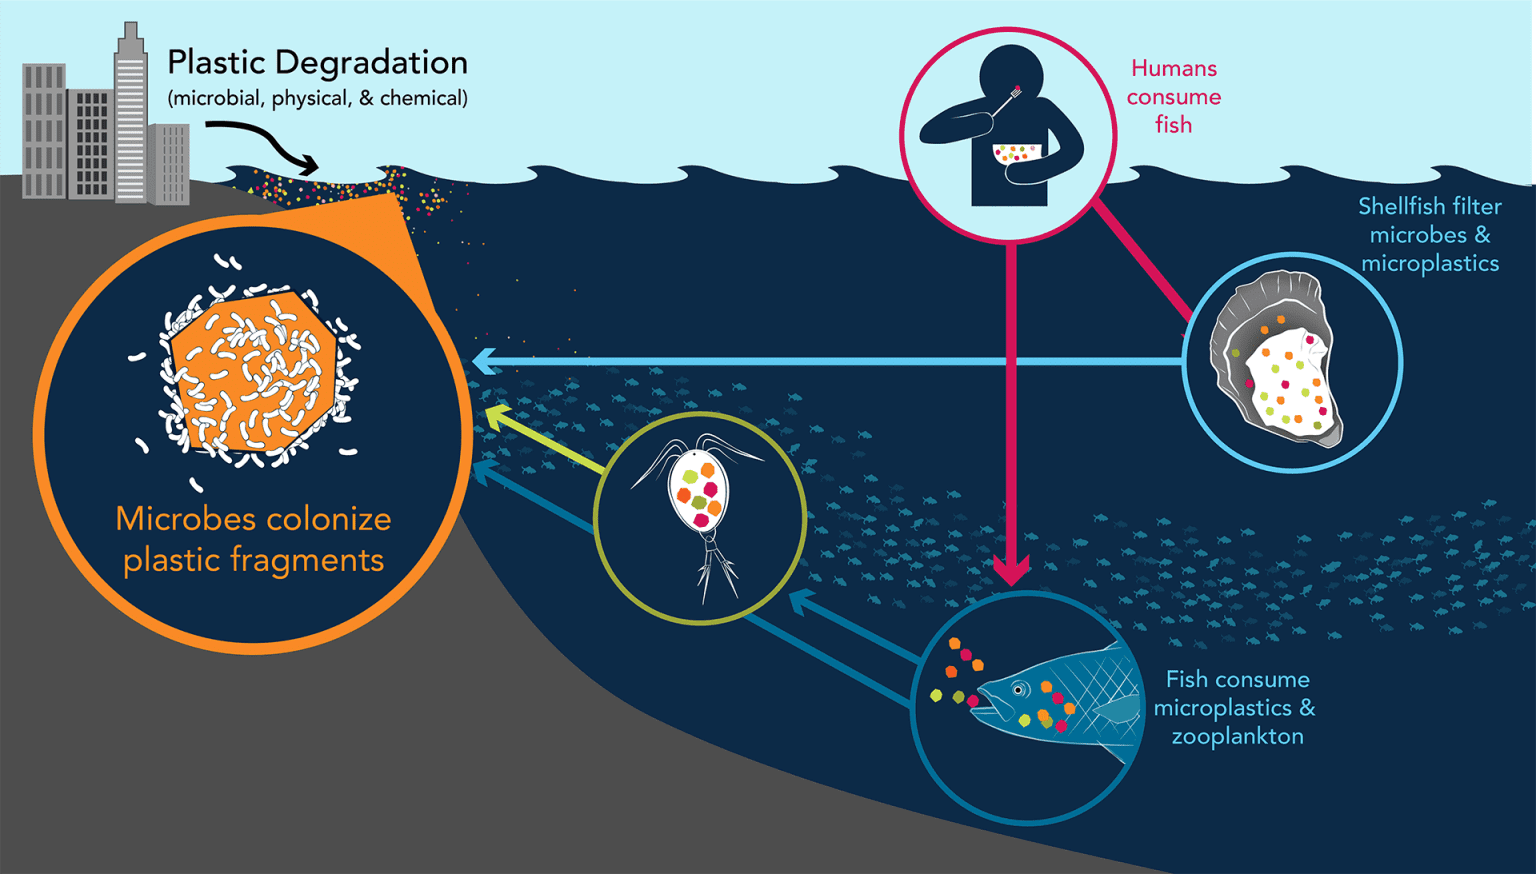
This illustration shows how plastic breaks down into microplastics, is eaten by smaller marine organisms, and then moves upward through the food chain to fish, shellfish and humans. It supports ESS links between microplastics, pollution transfer, and human impacts on ecosystems. Source
Human impacts on energy flow and matter transfer
Burning fossil fuels, deforestation, urbanization and agriculture alter the flow of energy and transfer of matter in ecosystems.
Although higher CO₂ could increase photosynthesis in theory, the wider impacts of pollution and global warming generally reduce primary productivity.
Deforestation reduces photosynthetic capacity, lowers biomass, and disrupts food webs.
Urbanization and intensive agriculture often reduce ecosystem biomass and simplify trophic structure.
Main exam message: human activity often reduces primary productivity, ecosystem biomass and food web stability.
Checklist: can you do this?
Explain why energy transfer between trophic levels is always inefficient using the second law of thermodynamics.
Construct and interpret a food chain, food web and ecological pyramid from given data.
Calculate net productivity from GP and respiration, and work out ecological efficiency between trophic levels.
Distinguish clearly between bioaccumulation and biomagnification using an example.
Apply the topic to sustainability by explaining why diets based on lower trophic levels are usually more sustainable.
HL only: autotroph types and productivity
Photoautotrophs use light as their external energy source in photosynthesis.
Chemoautotrophs use energy from exothermic inorganic chemical reactions in chemosynthesis.
In ecosystems with little or no light, chemoautotrophs can be the main energy source for the food web.
Primary productivity = rate of biomass production by autotrophs using an external energy source and inorganic carbon.
Units are usually kg carbon m year.
Secondary productivity = gain in biomass by consumers from absorbed and assimilated food.
Net primary productivity (NPP) is the biomass sustainably available to primary consumers.
Maximum sustainable yield (MSY) equals the net primary or net secondary productivity of a system.
Sustainable yields are higher at lower trophic levels, so plant-based food production is generally more efficient and easier to sustain.
Entropy increases as biomass passes through ecosystems; living systems maintain order only because overall entropy rises, largely through cellular respiration.
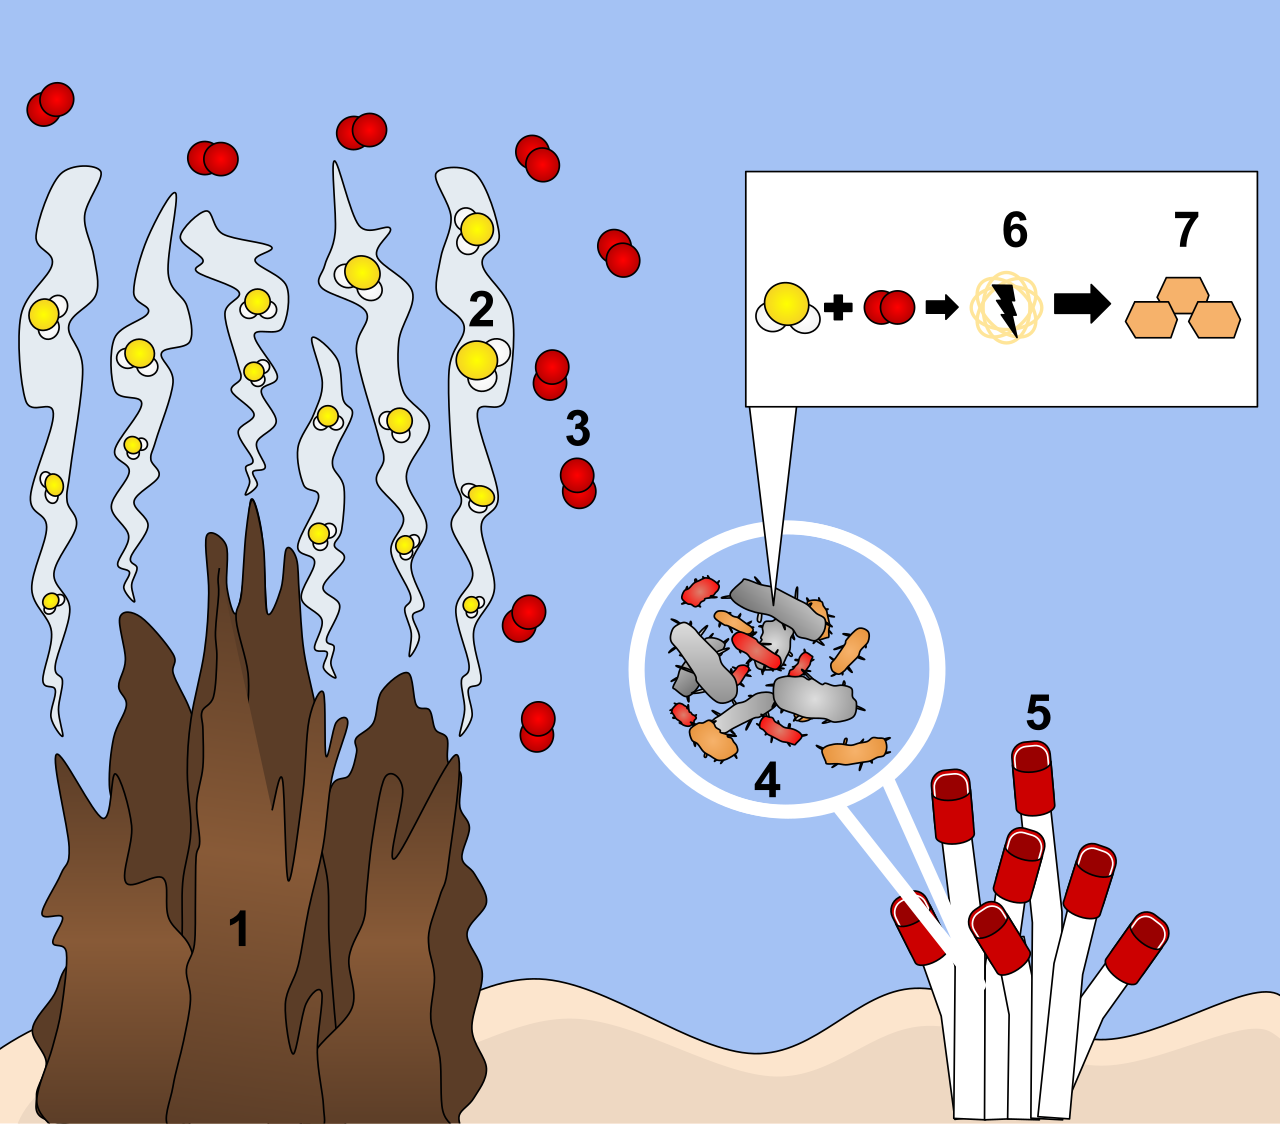
This diagram shows chemosynthesis at hydrothermal vents, where microbes use chemical energy instead of light to make organic molecules. It is excellent for the HL-only distinction between photoautotrophs and chemoautotrophs. Source
Exam traps to avoid
Do not say energy is recycled in ecosystems; it flows and is lost as heat.
Do not confuse biomass with number of organisms.
Do not assume the 10% rule is exact in every ecosystem.
Do not confuse productivity (a rate) with biomass (an amount at a given time).
Do not mix up bioaccumulation and biomagnification.
Do not forget that NP is what is available for growth, future biomass, and potentially harvest.