
AQA Syllabus focus:
'Levels of measurement: nominal, ordinal and interval; coding in content analysis.'
Understanding levels of measurement helps psychologists describe data accurately and make sensible decisions about analysis. Coding in content analysis also depends on clear categories so that complex material can be organized consistently.
Levels of measurement
Psychologists need to identify the level of measurement used by their data. This shows how much information the scores contain and sets limits on how those scores should be interpreted.
Levels of measurement: The way data are classified according to the amount of information they provide, from simple categories to scales with equal units.
At AQA A-Level, the required levels are nominal, ordinal, and interval.
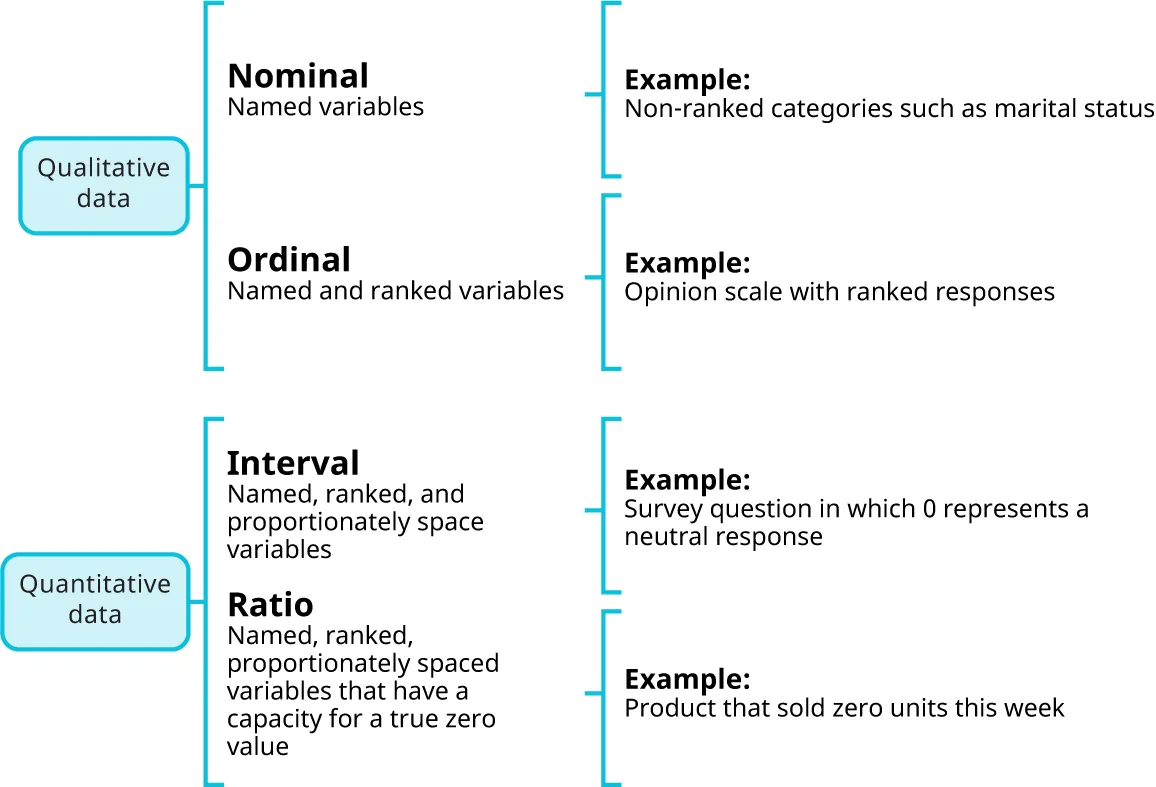
This diagram summarizes how measurement scales add information in steps: nominal (named categories), ordinal (named + ranked), and interval (named + ranked + equal spacing). It helps clarify why interval data allow meaningful comparisons of differences, while nominal/ordinal data do not support the same numerical interpretation. Source
Moving from nominal to interval means the data become more informative and usually more flexible to analyze.
Nominal data
Nominal data place people, responses, or observations into named categories.
Nominal data: Data that are divided into categories that are different from one another but have no numerical order.
This means the categories are labels, not scores. A researcher may use numbers such as 1, 2, and 3 to record categories, but these numbers do not show more or less of anything. They are only a convenient coding system.
Key features of nominal data include:
categories are separate and distinct
there is no rank order
the main information is how many cases fall into each category
categories should usually be mutually exclusive, so each item fits one category only
In psychology, nominal data are common when classifying behavior, types of response, or groups of participants.
Ordinal data
Ordinal data go one step further because the categories or scores can be placed in rank order.
Ordinal data: Data that can be ordered from highest to lowest or from most to least, but where the gaps between ranks are not known to be equal.
Ordinal data tell us which score is greater or smaller, but they do not tell us exactly how much greater or smaller. If one person is ranked first and another is ranked second, the difference between them may not match the difference between second and third.
This is why ordinal data are useful for showing position, preference, or relative standing, but they are less precise than interval data. Rating scales often produce ordinal data when the researcher can justify order but not equal distances between points.
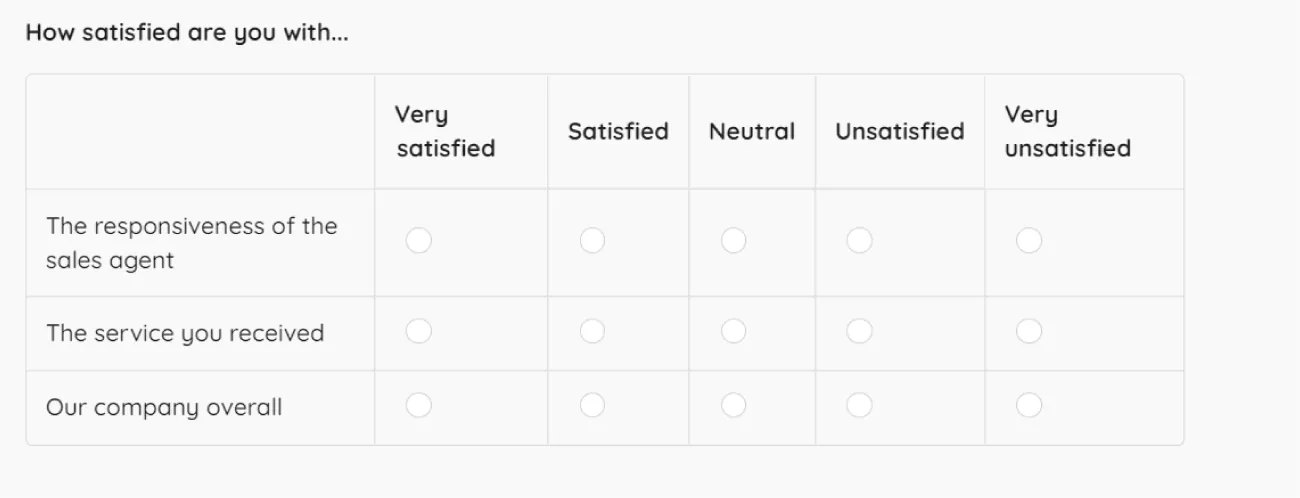
This figure shows a Likert-style response scale with ordered categories (e.g., Very satisfied → Very unsatisfied). It illustrates why these data are ordinal: responses can be ranked, but the psychological distance between adjacent options is not guaranteed to be equal. Source
Interval data
Interval data contain the most information of the three levels required by the specification.
Interval data: Data measured on a scale in which the units are equal, so the difference between any two adjacent values is the same across the scale.
Because the intervals are equal, the difference between two scores is meaningful. A change of 10 units has the same meaning anywhere on the scale. This makes interval data more precise than ordinal data and more informative than nominal data.
Interval data are often produced by standardized measurements or test scores where equal units can be assumed. The important point is not just that the data use numbers, but that those numbers represent equal steps on the scale. If equal spacing cannot be justified, the data should not be treated as interval.
Why the distinction matters
Correctly identifying the level of measurement prevents researchers from claiming more than their data actually show. A set of category labels cannot support the same kind of interpretation as a scale with equal intervals.
A common source of confusion is that all three levels may be recorded with numbers. For example, categories in a coding sheet may be marked 1, 2, or 3. This does not automatically make the data interval. To decide the level of measurement, ask what the numbers mean:
If they simply name categories, the data are nominal.
If they place responses in order, the data are ordinal.
If they represent equal units, the data are interval.
This distinction is especially important in psychology because researchers often convert complex behavior or language into codes. The code numbers may look precise, but the measurement level depends on the structure of the coding system, not on the presence of digits.
Coding in content analysis
In content analysis, researchers examine communication such as written text, spoken language, or images by sorting material into categories.
Content analysis: A method of analyzing communication by identifying categories, themes, or features in the material being studied.
A central stage in this method is coding, which turns raw material into an organized record.
Coding: The process of assigning labels or numbers to units of material so they can be classified and recorded systematically.
Coding allows qualitative material to be reduced into data that can be counted or compared. The researcher decides what category a word, phrase, sentence, image, or theme belongs to, and then records that decision on a coding sheet.
Building useful coding categories
Good coding depends on categories being clear and carefully designed.
If categories are vague or overlapping, the resulting data will be confusing.
Useful coding categories should be:
clearly defined, so the coder knows exactly what belongs in each category
appropriate to the material, so they match what is actually being studied
mutually exclusive where possible, so one unit is not placed in several categories at once
systematic, so the same rules are applied throughout
Most coding in content analysis produces nominal data, because the researcher is counting the frequency of categories. Sometimes coding can produce ordinal data if responses are ranked, such as low, medium, and high intensity. Interval data are much less common in coding and should only be claimed when equal distances between scale points are genuinely justified.
This shows the close link between levels of measurement and coding: the way categories are created determines the kind of data the content analysis will generate.
Practice Questions
State two characteristics of nominal data. (2 marks)
1 mark for stating that nominal data are placed into categories or classifications.
1 mark for stating that the categories have no rank order, or that any numbers used are labels only.
Explain the difference between nominal, ordinal, and interval data. Refer to coding in content analysis in your answer. (6 marks)
1 mark for explaining that nominal data consist of named categories.
1 mark for explaining that nominal categories have no order.
1 mark for explaining that ordinal data can be ranked or ordered.
1 mark for explaining that the gaps between ordinal ranks are not known to be equal.
1 mark for explaining that interval data have equal units or equal intervals between values.
1 mark for linking this to content analysis, for example by stating that coding usually produces nominal data, may produce ordinal data if categories are ranked, and only rarely produces interval data.
FAQ
Not always, but in A-Level Psychology they are usually treated cautiously as ordinal unless there is a strong reason to assume equal spacing between points.
A single response scale such as 1 to 5 usually shows order clearly, but it does not automatically prove that the gap between each point is identical in psychological meaning.
A unit of analysis is the specific piece of material the researcher decides to code.
It might be:
one word
one sentence
one theme
one image
one speaker turn
The choice matters because it changes what gets counted. A study coding single words may produce very different results from a study coding whole themes.
This should be planned before coding begins.
Common options include:
adding an other category
adding an unclear category
revising the coding rules if many responses do not fit
Forcing a response into the wrong category is a poor choice because it distorts the data. A small number of uncodable responses is usually better than misleading classification.
Too many categories can make coding harder rather than better.
If the categories are very narrow:
coders may struggle to tell them apart
frequencies may become very small
patterns in the data may be harder to see
A smaller set of clearly distinct categories often produces more useful results than a long list of categories with only slight differences.
It is only justified when the coding system genuinely uses equal units.
This usually requires a very carefully constructed scale where each step represents the same increase or decrease. Simply numbering categories 1, 2, 3, and 4 is not enough.
If equal spacing cannot be defended clearly, the safer choice is to treat the coded data as nominal or ordinal instead.
