
AQA Syllabus focus:
'Introduction to statistical testing and the sign test, including when to use and how to calculate the sign test.'
The sign test is a simple inferential test used in psychology to judge whether a pattern in paired results is likely to reflect a real difference rather than chance variation.
Statistical testing and the sign test
In psychological research, statistical testing helps researchers decide whether the results they found are strong enough to be considered significant. This means asking whether the pattern in the data is unlikely to have happened just by chance.
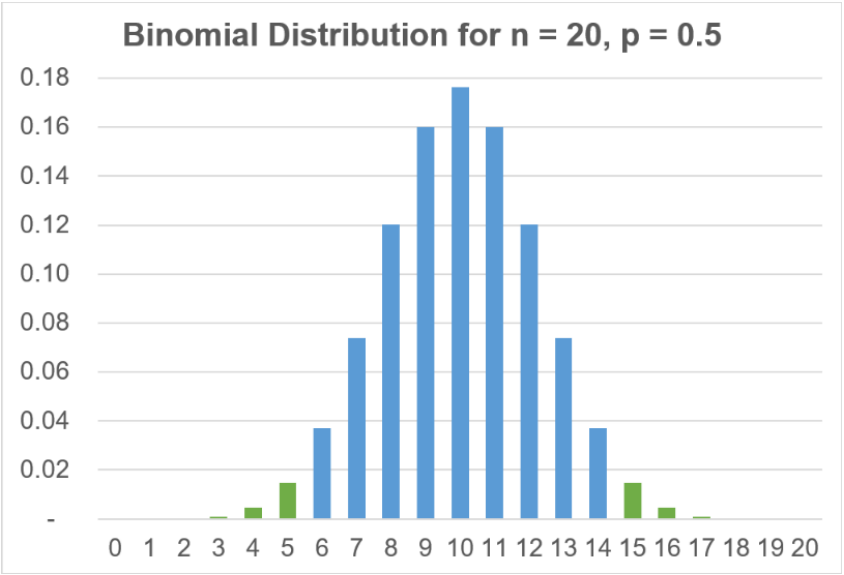
This figure plots the binomial distribution (with ) and highlights the tail regions that represent ‘rare’ outcomes under the null hypothesis. It helps students see why a large imbalance of pluses vs minuses is treated as statistically significant: it falls into the low-probability tails of the distribution. Source
The sign test is one of the simplest inferential tests students need to know, because it focuses only on the direction of differences between paired scores.
Sign test: A non-parametric inferential test used to assess whether there is a significant difference between two sets of related data by looking at the direction of the differences.
The sign test does not use the size of the difference between scores. Instead, it checks whether one condition tends to produce higher or lower scores than the other. This makes it useful when the data can be reduced to simple categories such as positive and negative signs.
When to use the sign test
The sign test should be used when the research situation matches certain conditions.
It is a test of difference.
The researcher wants to know whether there is a difference between two conditions, treatments, or occasions.
The data are related or paired.
This usually means a repeated measures design, where the same participants take part in both conditions.
It can also be used when participants are paired in a matched pairs design.
The data can be treated as nominal after comparison.
Each pair of scores is turned into a sign:
+ if one condition produced the higher score
- if the other condition produced the higher score
The researcher is interested in the direction of change, not the size of change.
For example, the test is suitable when each participant produces two scores and the psychologist compares them pair by pair. If a participant shows no difference between the two scores, that pair does not help show direction and is removed from the calculation.
A good way to remember the sign test is that it asks: Are there enough pluses or minuses in one direction to suggest a real difference?
How to calculate the sign test
To calculate the sign test, the researcher compares each pair of related scores and records the direction of the difference.
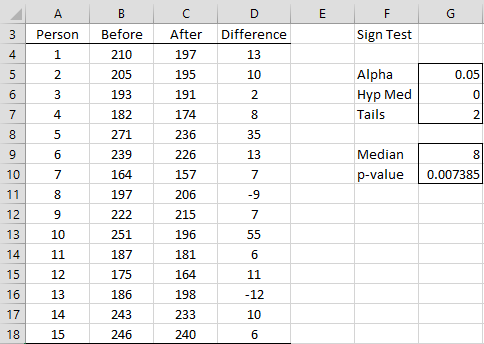
This worked example shows paired measurements (e.g., “Before” and “After”) and the computed difference for each participant, making it clear how each pair is converted into a direction of change. It visually reinforces that the sign test reduces paired data to whether the change is positive or negative (and that ties would be treated separately). Source
= observed value used in the sign test
= number of positive signs
= number of negative signs
= number of usable pairs after ties are removed
The key idea is that the observed value for the sign test is the smaller of the two sign totals, not the larger one.
Step-by-step process
State the hypotheses.
The null hypothesis says there is no significant difference between the two conditions and any pattern is due to chance.
The alternative hypothesis says there is a significant difference.
Compare each pair of scores.
Decide whether the second score is higher or lower than the first, or vice versa, depending on how the data are arranged.
Assign a sign to each pair.
Use + for a difference in one direction.
Use - for a difference in the opposite direction.
Ignore ties.
If the two scores in a pair are the same, record 0 and remove that pair from the final totals.
Count the signs.
Add up the total number of pluses and the total number of minuses.
Find the observed value.
Choose the smaller of the two totals. This is the value compared with the critical value.
Work out .
This is the number of pairs left after any zeros have been removed.
Use a sign test critical values table.
Find the row for the correct value of .
Use the correct level of significance required by the question, usually 0.05.
Make sure the correct tail is used if the hypothesis is directional or non-directional.
Critical value: The value from a statistical table that the observed result must equal or be more extreme than for the result to be judged significant.
Interpreting the result
Once the observed value and the critical value have been identified, the researcher compares them.
If the observed value is equal to or less than the critical value, the result is significant.
The null hypothesis is rejected.
If the observed value is greater than the critical value, the result is not significant.
The null hypothesis is retained.
This matters because the sign test is designed to show whether the pattern of pluses and minuses is unlikely to have happened by chance alone. A significant result suggests that one condition consistently produced higher or lower scores than the other.
However, the sign test does not show:
how large the difference is
how important the difference is in practical terms
why the difference occurred
Common mistakes and exam tips
Students often lose marks on the sign test because of small procedural errors.
Do not include zeros in the final total for .
Do not use the larger sign total as the observed value.
Keep the sign system consistent throughout the calculation.
Check the hypothesis carefully before selecting the correct critical value.
Use the reduced sample size after ties are removed, not the original number of participants.
Interpret the result correctly:
smaller or equal to the critical value = significant
larger than the critical value = not significant
In exam answers, it is important to show clear understanding of when the sign test is appropriate, how signs are assigned, and how significance is decided from the critical value table.
Practice Questions
Identify two features of a data set that would make the sign test an appropriate statistical test. (2 marks)
1 mark for stating that the test is used for a difference between two conditions.
1 mark for stating that the data are related/paired and converted into plus and minus signs or treated as nominal data.
Outline how a psychologist would calculate and interpret a sign test for paired scores from two conditions. (6 marks)
1 mark: State that each pair of related scores is compared.
1 mark: Award signs such as + and - to show direction of difference.
1 mark: Remove any ties or zero differences.
1 mark: Count the number of pluses and minuses and take the smaller total as the observed value.
1 mark: Use the number of non-zero pairs to find the correct critical value in the sign test table.
1 mark: Correct interpretation:
observed value equal to or less than critical value = significant, reject null hypothesis
observed value greater than critical value = not significant, retain null hypothesis
FAQ
They are closely related. The sign test is essentially a special use of the binomial idea for paired data.
Each usable pair produces one of two outcomes:
positive
negative
That means the test is based on the probability of getting a particular split of signs if chance were operating. In many software packages, the sign test may even be reported as an exact binomial test.
Because the sign test uses only the direction of each difference, not the size.
For example, one participant improving by 1 point and another improving by 20 points would both simply count as the same sign if the direction matched.
This makes the test simple and robust, but it also means some information is lost.
Not for the final significance decision, as long as you stay consistent.
If you reverse the rule, the number of pluses and minuses will swap, but the smaller total used as the observed value will stay the same.
What matters is:
use one rule throughout
label signs clearly
interpret the direction correctly when writing your conclusion
As the number of usable pairs increases, the critical value usually changes because chance can produce a wider range of sign patterns in larger samples.
In simple terms:
with very small $N$, only extremely uneven sign totals are significant
with larger $N$, the table adjusts for the bigger sample size
That is why using the correct value of $N$ after removing ties is essential.
You should still report it as not significant.
Do not say the null hypothesis is “almost rejected.” In exam psychology, the decision is based on the rule in the table:
significant
or not significant
You may say there is a trend only if the wording of the question or broader context allows it, but this does not count as a statistically significant result.
