Anthropogenic causes of climate change
Climate change in this topic is limited to anthropogenic increases in atmospheric carbon dioxide (CO₂) and methane (CH₄).
These gases increase the warming effect of the atmosphere, so the key exam idea is that humans are driving the rise in these gases.
Exam skills / NOS: distinguish positive correlation from negative correlation.
Exam skills / NOS: distinguish correlation from causation.
Example: Antarctic ice-core data shows a positive correlation between global temperature and atmospheric CO₂ over very long timescales, but correlation alone does not prove causation.
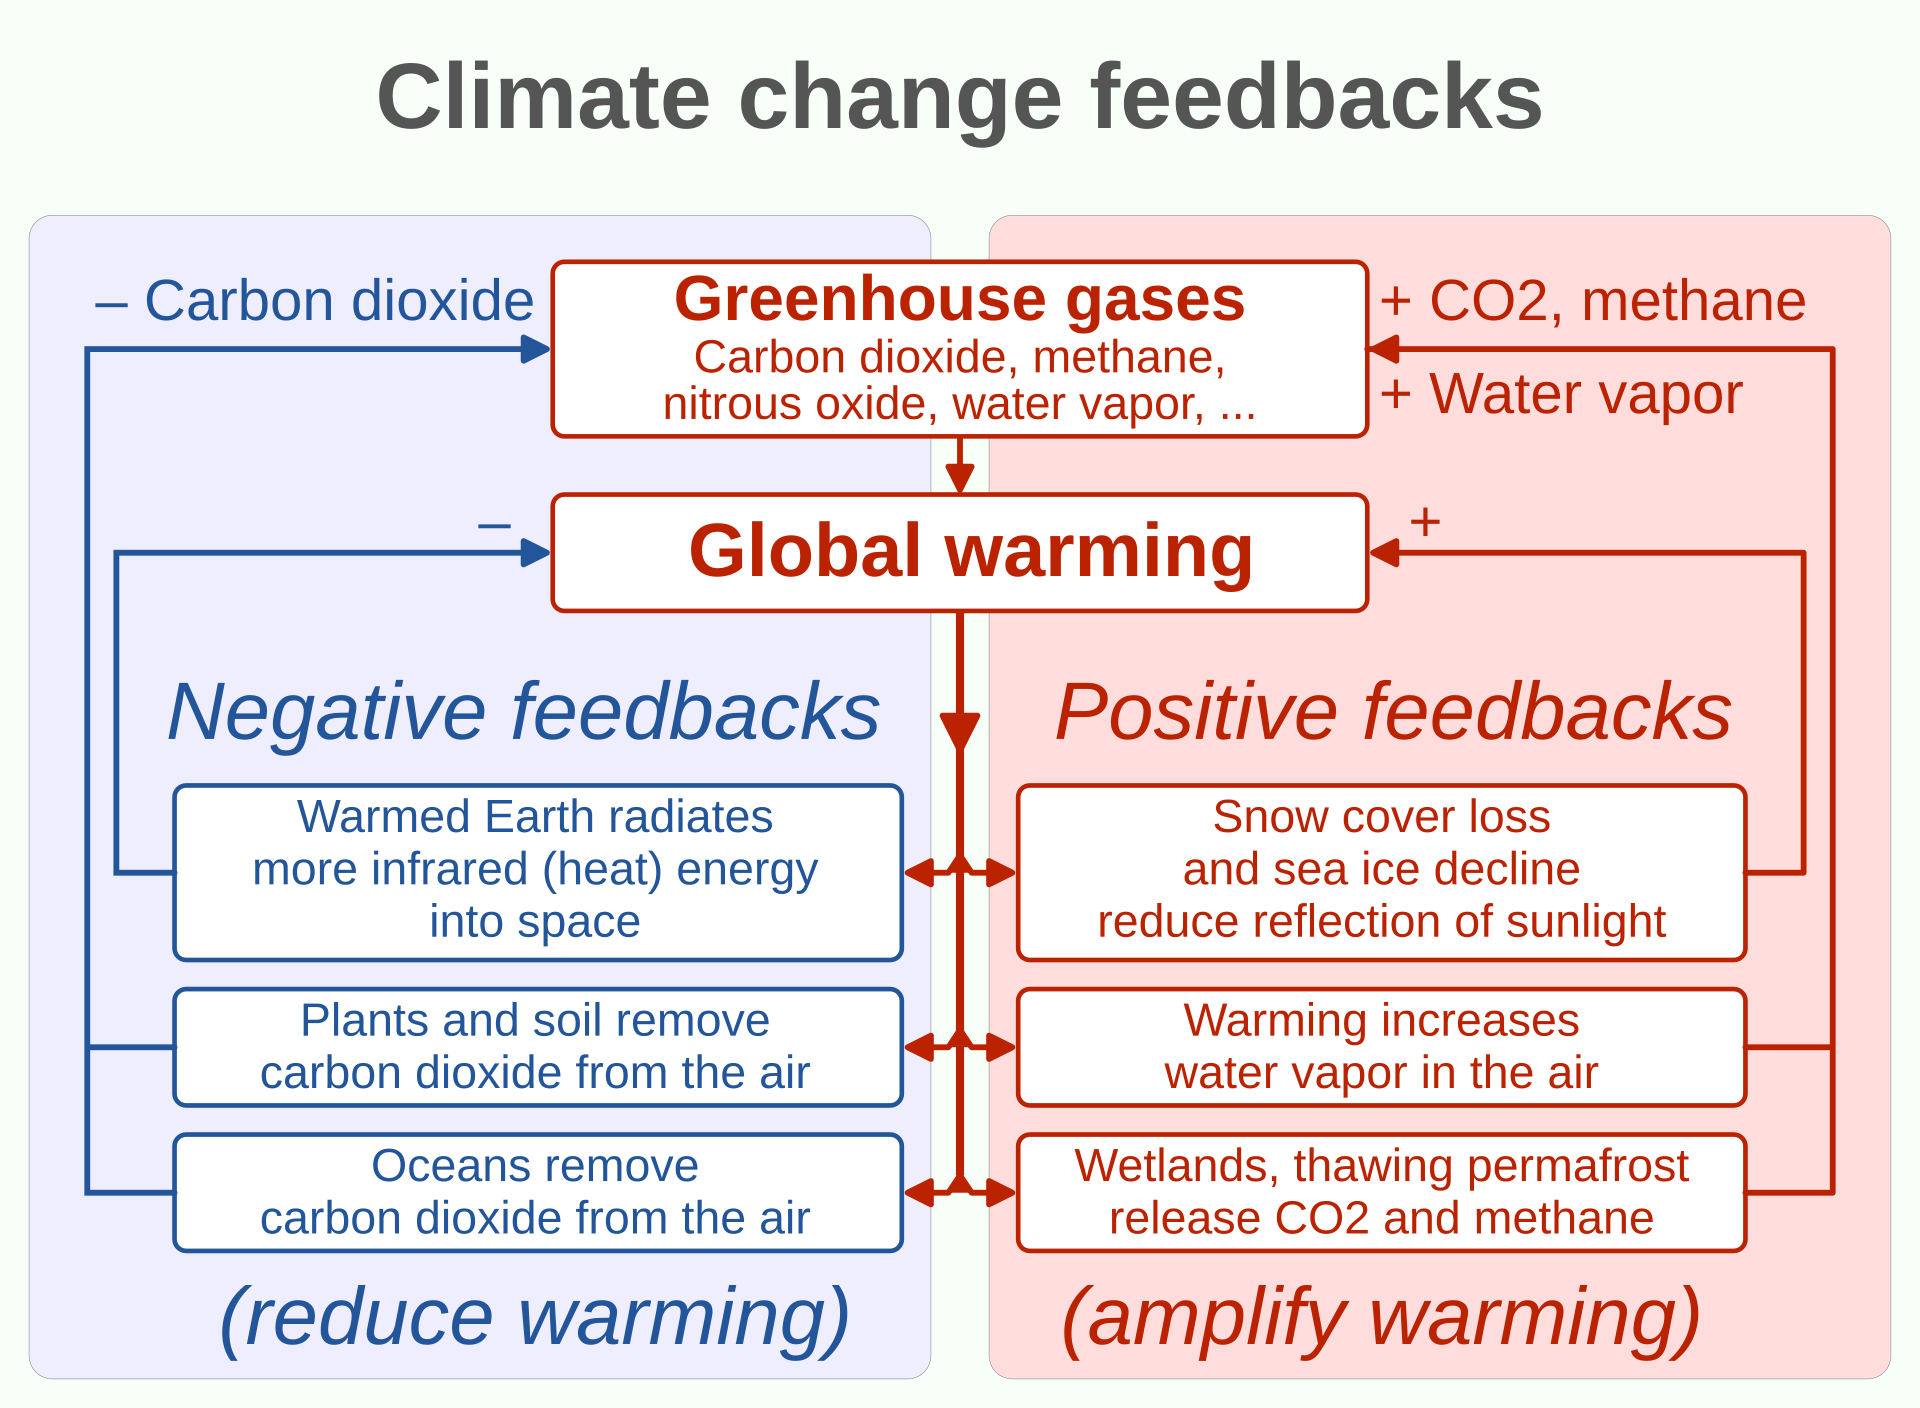
This diagram shows how warming can trigger further warming through linked feedback loops. It is ideal for revising positive feedback cycles, especially the idea that climate change can become self-amplifying. Source
Positive feedback and tipping points
Positive feedback = a change causes further changes that amplify the original warming.
Examples of positive feedback cycles in global warming:
release of CO₂ from the deep ocean
increased absorption of solar radiation after loss of reflective snow and ice
faster decomposition of peat and previously undecomposed organic matter in permafrost
release of methane from melting permafrost
increases in droughts and forest fires
Tipping point = a threshold after which change becomes rapid or difficult to reverse.
Boreal forests / taiga are a key tipping-point example.
Warmer temperatures and decreased winter snowfall can increase drought and reduce primary production.
This can cause forest browning, more frequent and intense fires, and legacy carbon combustion.
Result: boreal forests may shift from net carbon accumulation to net carbon loss.
Habitat and ecosystem impacts
Polar habitat change includes melting of landfast ice and sea ice.
Emperor penguins may lose breeding grounds if landfast ice breaks out too early in the Antarctic.
Walruses may lose important sea-ice habitat in the Arctic.
Climate warming can alter ocean currents and reduce the timing/extent of nutrient upwelling.
Warmer surface water can prevent nutrients reaching the surface, decreasing ocean primary production.
Lower primary production means less energy flow through marine food chains.
Climate change can also cause poleward and upslope range shifts.
Required examples:
upslope range shifts in tropical montane birds in New Guinea
range contraction and northward spread in North American tree species
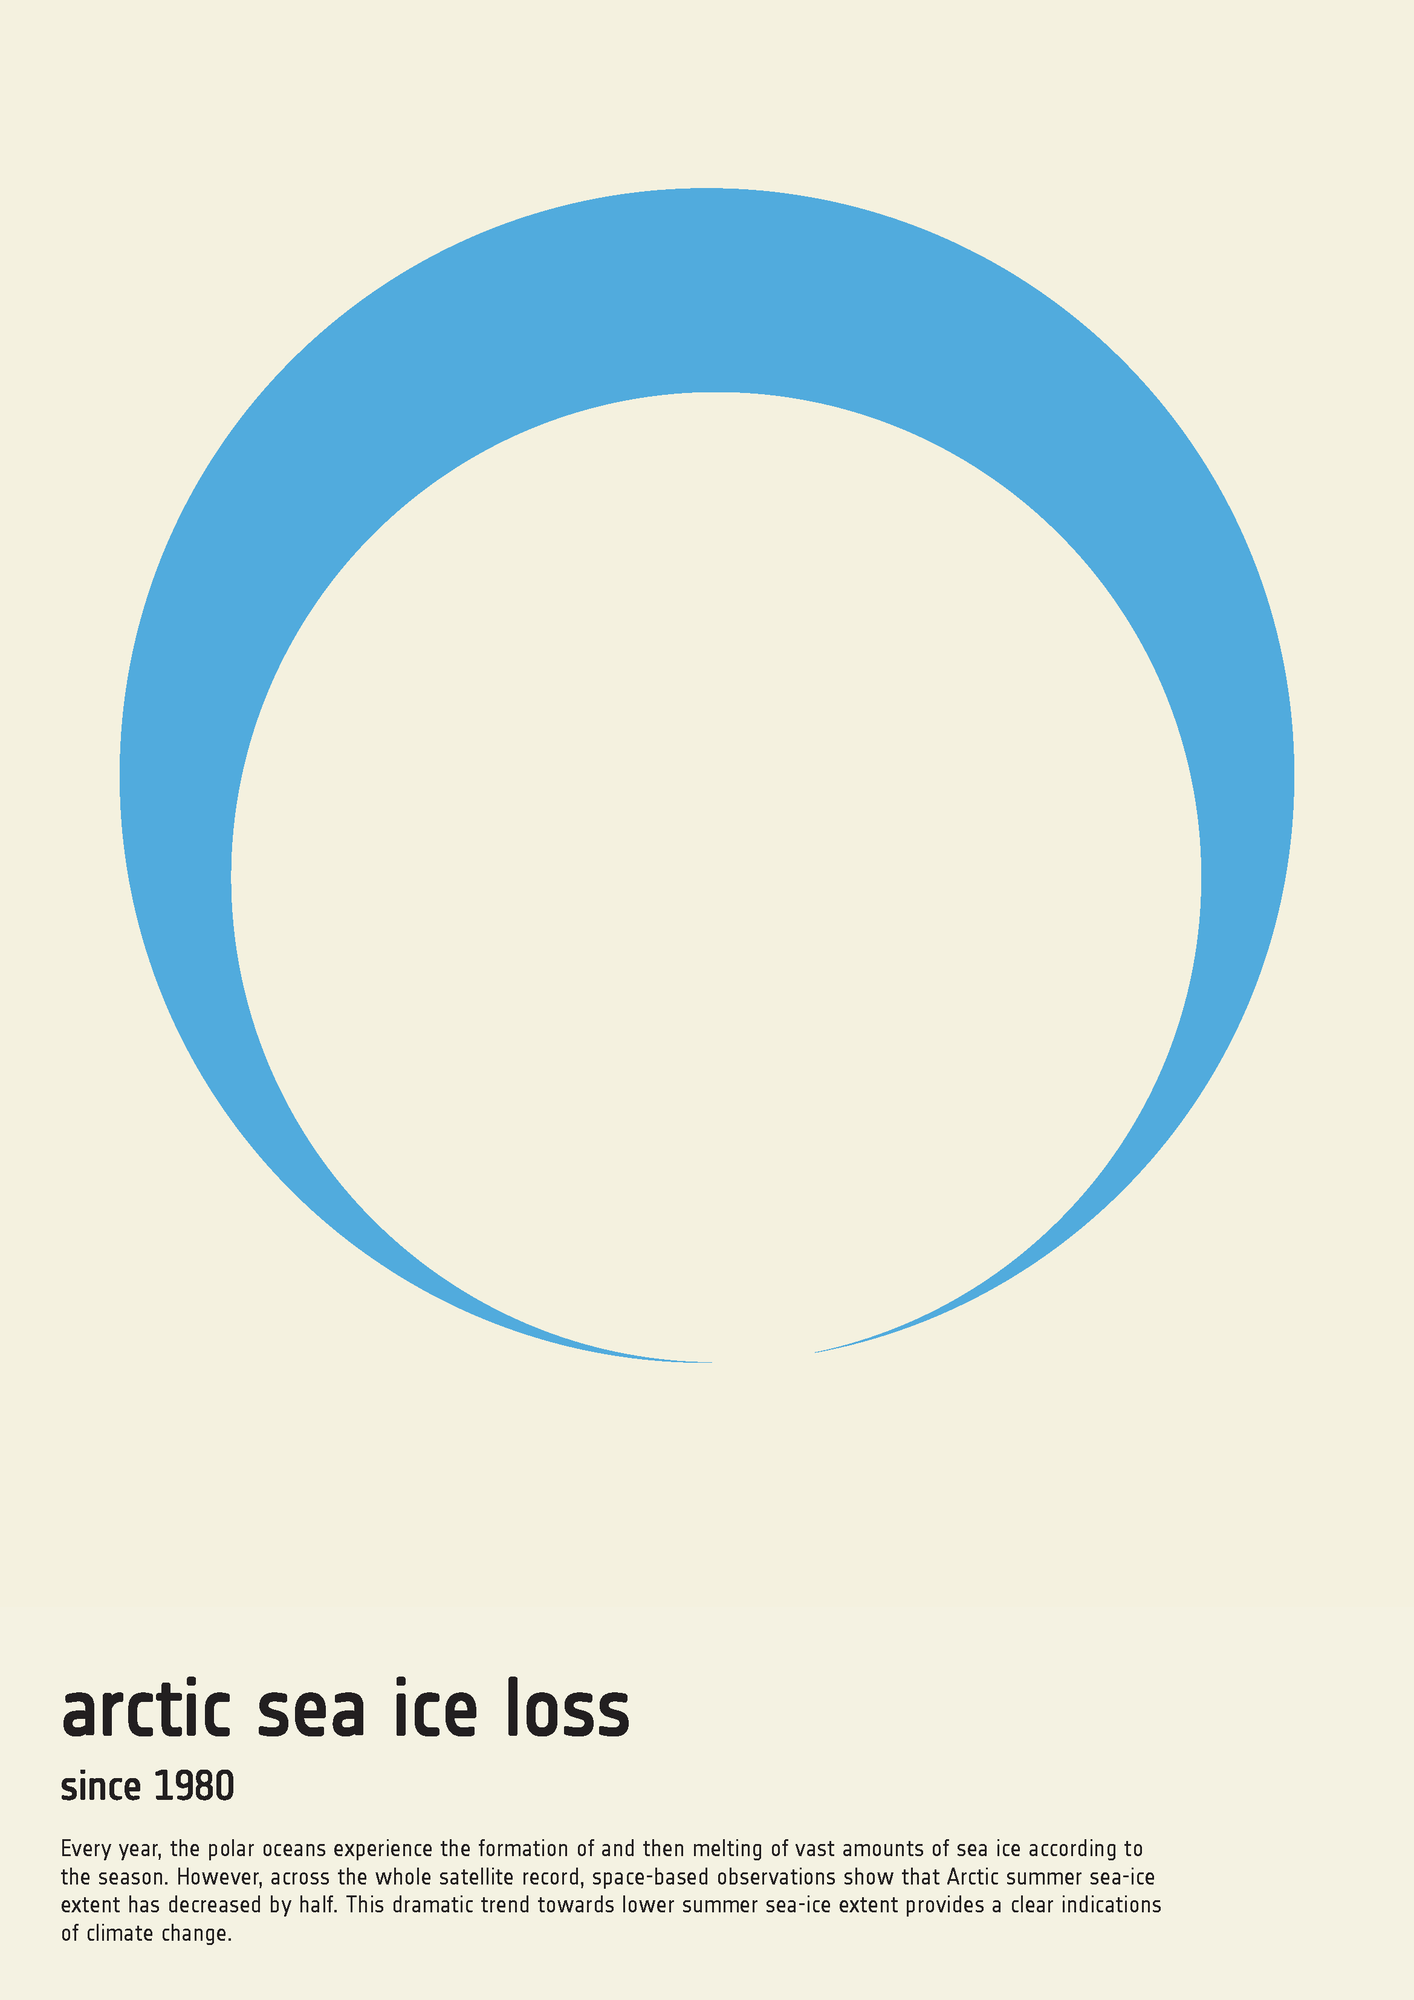
This image shows the strong decline in Arctic sea-ice extent, helping explain polar habitat change. It links directly to the syllabus examples of habitat loss affecting ice-dependent species. Source
Coral reefs and ecosystem collapse
Coral reefs are a key example of possible ecosystem collapse.
Increased CO₂ causes ocean acidification.
Ocean acidification suppresses calcification in corals, so reef-building becomes harder.
Increased water temperature causes coral bleaching.
Loss of corals can lead to the collapse of entire reef ecosystems.
Important responses that increase carbon sequestration:
afforestation
forest regeneration
restoration of peat-forming wetlands
Peat-forming wetlands are important because peat stores carbon in waterlogged soils.
NOS / debate: scientists debate whether plantations of non-native tree species or rewilding with native species is the better sequestration strategy.
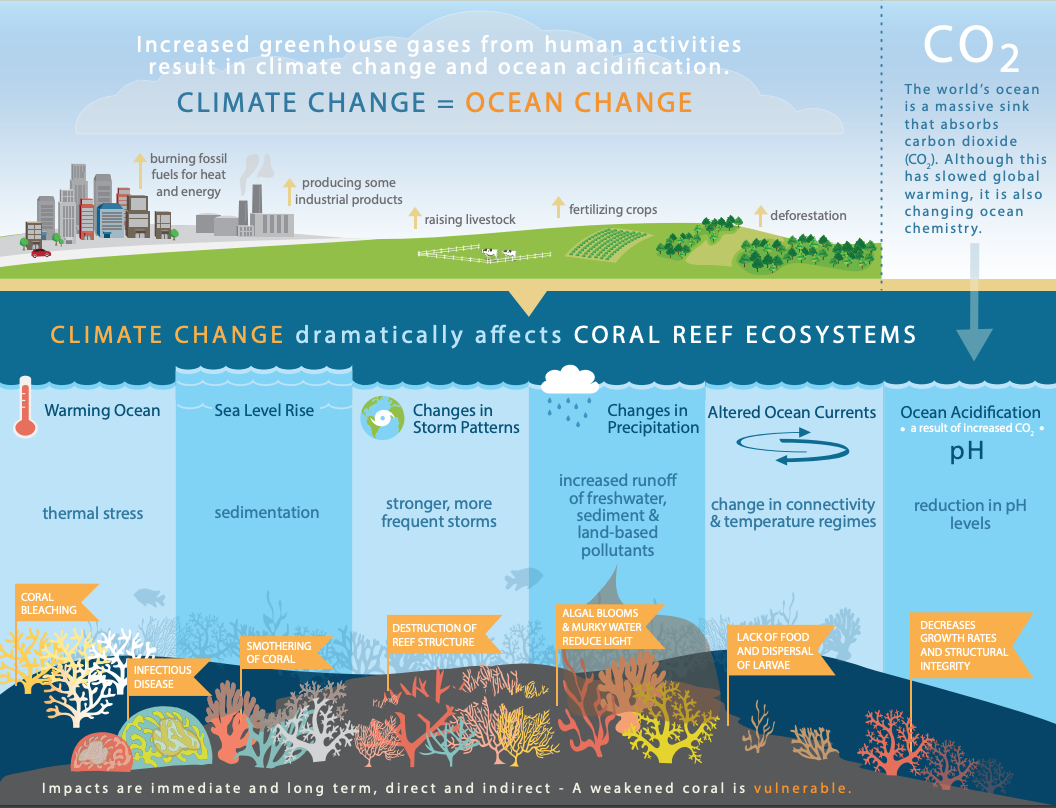
This infographic summarizes the two core reef threats in the syllabus: ocean acidification and warming-driven bleaching. It is useful for linking abiotic change to loss of coral structure and then to reef ecosystem collapse. Source
HL only: phenology, mismatch and evolutionary change
Phenology = research into the timing of biological events.
Important controlling variables include photoperiod and temperature patterns.
Phenological examples include flowering, budburst, bud set, bird migration and nesting.
Climate change can disrupt the synchrony of phenological events.
Within one ecosystem, temperature may act as the cue for one population, while photoperiod acts as the cue for another.
This can create phenological mismatch, where interacting species are no longer correctly timed.
Required examples:
Arctic mouse-ear chickweed spring growth and arrival of migrating reindeer
Great tit breeding and peak biomass of caterpillars in north European forests
Climate change can increase the number of insect life cycles per year.
Required example: spruce bark beetle.
Climate change can also drive evolution by changing the fitness of variants.
Required example: tawny owl colour variants changing in fitness as snow cover changes.
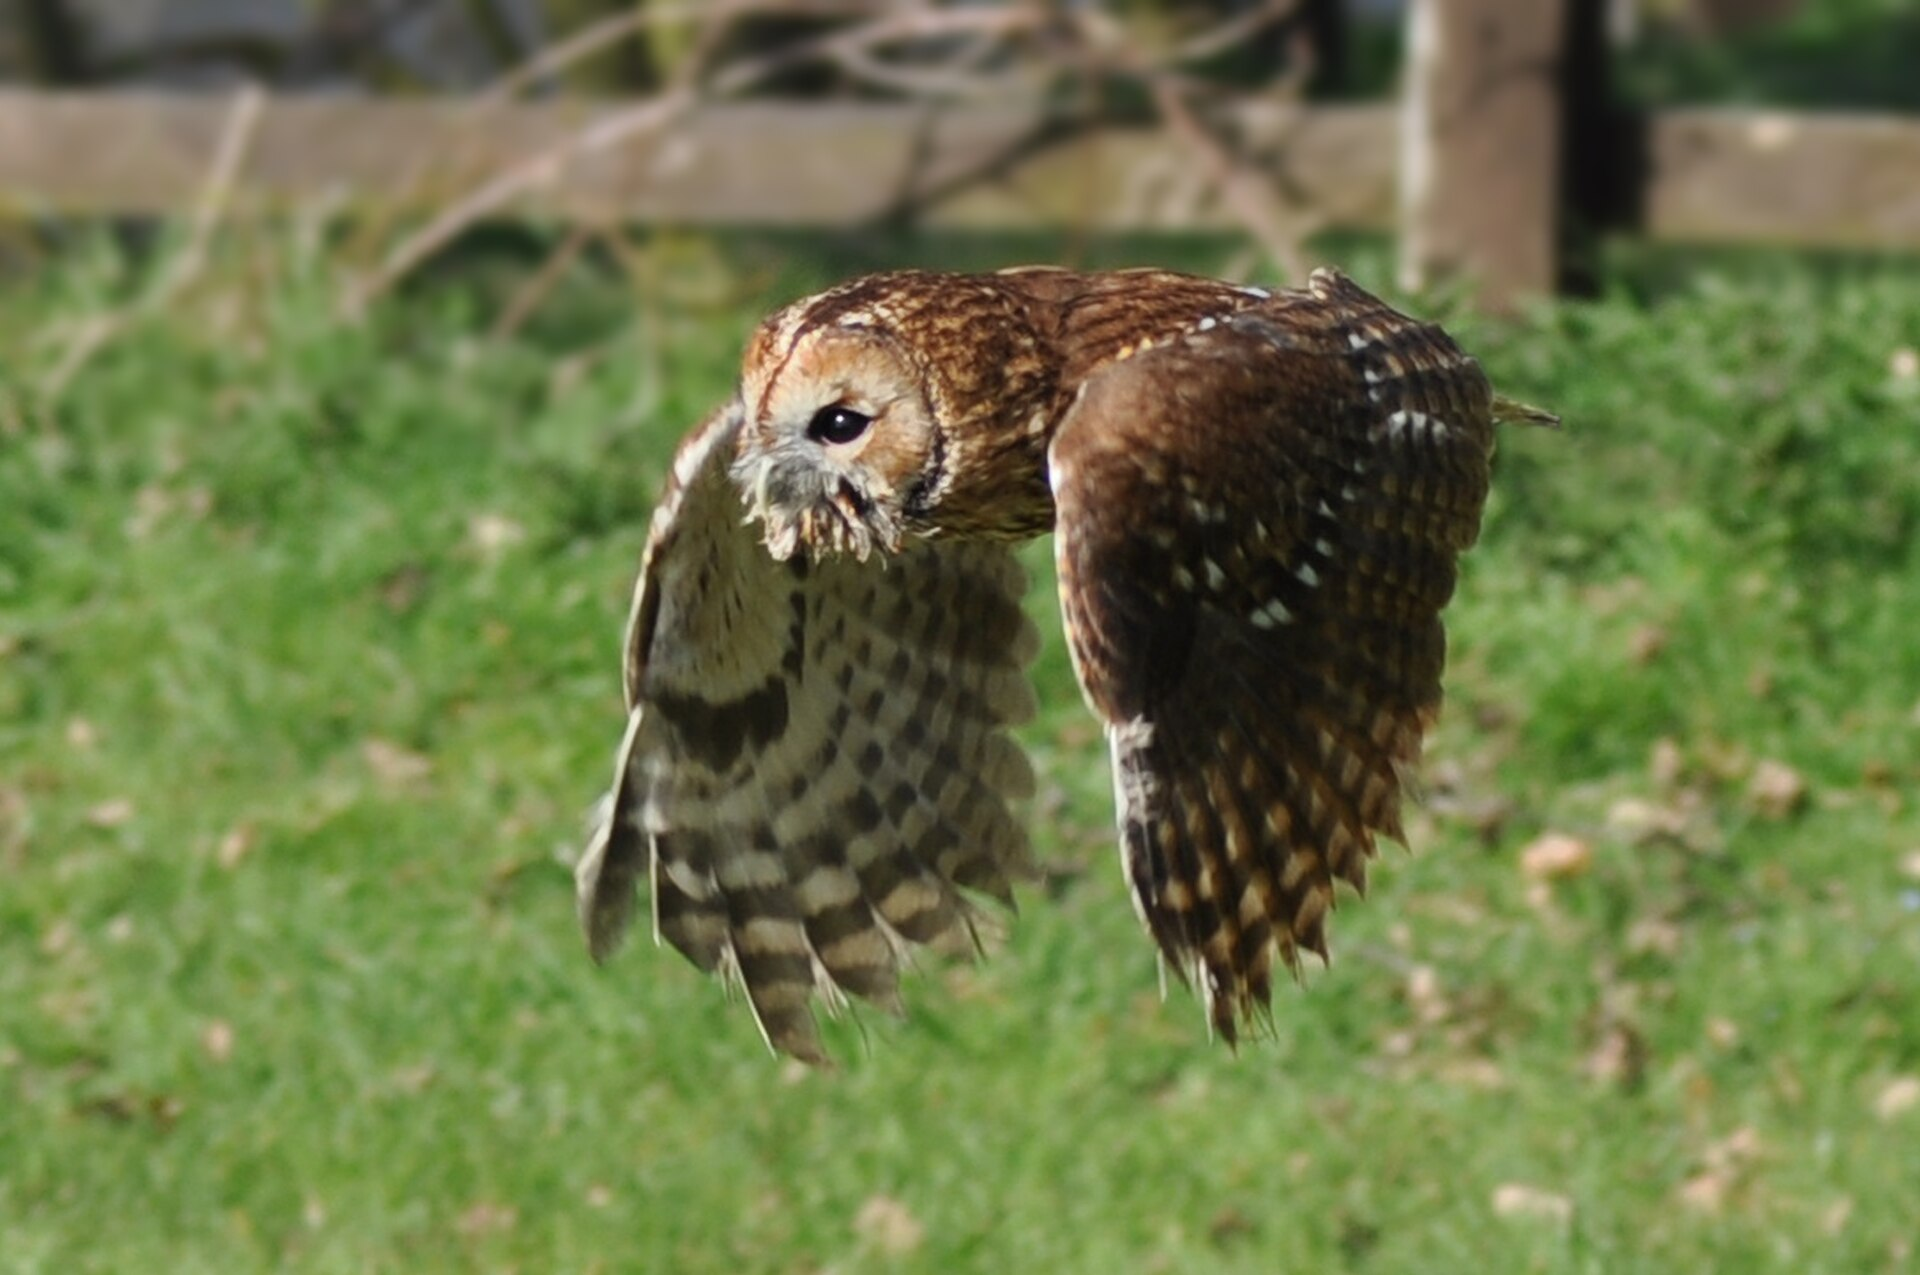
This image represents the tawny owl, the syllabus example for evolution as a consequence of climate change. In exam answers, connect this organism to changing snow cover and shifts in the fitness of colour variants. Source
Checklist: can you do this?
Explain how anthropogenic increases in CO₂ and CH₄ drive climate change.
Distinguish correlation from causation using the Antarctic ice-core example.
Describe at least one positive feedback cycle and one tipping point.
Interpret the effects of climate change on polar habitats, upwelling, species ranges or coral reefs.
Use the HL examples of phenological mismatch, spruce bark beetle or tawny owl evolution in a clear exam response.